
Figures & data
Figure 1. mTBK1 MNs resemble typical features of ALS patients. (a) Table showing the different mTBK1 hiPSC lines derived from ALS patients. (b) Immunoblot analysis of endogenous TBK1 protein levels in CTRL and mTBK1 MNs at DIV14 (One-Way ANOVA followed by Sidak´s multiple comparisons test: *p < 0.05). (c) Immunofluorescence labeling of CTRL and mTBK1 MNs against ChAT. From DIV28, mTBK1 show reduced number of CHAT+ cells (two-way ANOVA followed by Holm-Sidak´s multiple comparisons test *p < 0.05; **p < 0.01). (d) Heatmap showing decreased phosphorylation levels of AKT-MTOR pathway interplayers in mTBK1 MNs compared to CTRL (two-way ANOVA followed by Holm-Sidak´s multiple comparisons test. AKT Thr308 **p < 0.01; AKT Ser473 **p < 0.01; PRKAA/AMPKa Thr172 **p < 0.01; MTOR Ser2481 **p < 0.01; GSK3A Ser21 **p < 0.01; GSK3B Ser9 **p < 0.01; RPS6KB/p70 S6 kinase Thr241/Ser424 ***p < 0.001; BAD Ser112 **p < 0.01; RPS6KA1/RSK1 Ser380 **p < 0.01; PTEN Ser380 **p < 0.01; PDK1 Ser 241 **p < 0.01; MAPK1/ERK2-MAPK3/ERK1 Thr202/Tyr202 **p < 0.01). (e) Immunofluorescence labeling of CTRL and mTBK1 MNs against SLC18A3/VACHT and active CASP3 at DIV28. mTBK1 show increased numbers of SLC18A3/VACHT-CASP3 double-positive MNs (Mann Whitney test ***p < 0.001). Data information: all the experiments were performed in N = 3 independent replicates, and in (c and e) the lines CTRL I and mTBK1 I were used as representative of the respective genotypes. Scale bars: 50 μm in (c) and 25 μm in (e). To improve readability, in (b) is displayed only the statistical comparison between the 2 genotypes. Data are presented as mean ± SEM.
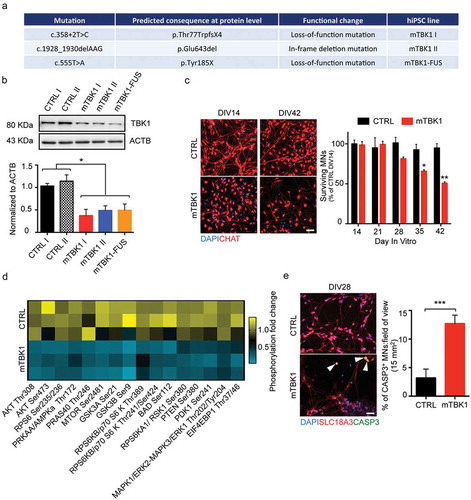
Figure 2. mTBK1 MNs accumulate cytosolic SQSTM1+ aggresomes. (a) Representative confocal images of CTRL and mTBK1 MNs at DIV14 immunolabeled against CHAT and SQSTM1. mTBK1 accumulate cytosolic SQSTM1+ structures compared to CTRL (One-Way ANOVA followed by Sidak´s multiple comparisons test: ***p < 0.001). (b) TEM analysis of cytosolic aggresomes in CTRL and mTBK1 MNs at DIV14. mTBK1 MNs show larger cytosolic fraction occupied by aberrant aggresomes (displayed in Bi; Mann Whitney test ***p < 0.001). (Bii) Cumulative frequency of aggresomes’ size distribution. (c, d, e, f and g) Representative confocal single-optical sections of mTBK1 MNs immunolabeled against SQSTM1 and PROTEOSTAT® Aggresome detection kit (Aggresomes – C), HDAC6 (d), ubiquitin (e), ATG5 (f) and LC3 (g). The SQSTM1-positive structures colocalize with the aggresome markers, but not with the autophagy proteins ATG5 and LC3. Data information: all the experiments were performed in N = 3 independent replicates, and in (b) the lines CTRL I and mTBK1 I were used as representative of the respective genotypes. In immunocytochemistry a minimum of n = 90 CHAT+ cells were analyzed. TEM analysis was performed on a minimum of n = 21 MNs. Scale bar: in (a) is 10 μm, in (b) is 2 μm, in the magnification 1 is 0.250 μm and in the magnification 2 is 0.500 μm. In (g) the scale bar is 5 μm in the upper row and 1 μm in the lower. To improve readability, in (a) is displayed only the statistical comparison between the 2 genotypes. Data are presented as mean ± SEM.
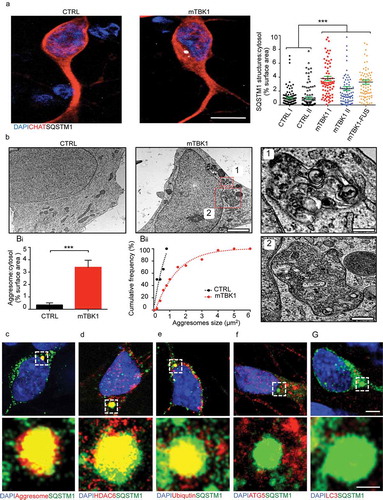
Figure 3. Small molecules screening identifies 4HPR as a potent modifier of mTBK1 phenotype. (a) Manhattan plot showing the intensity of SQSTM1 in mTBK1 MNs treated with the nuclear receptor ligands. In green: vehicle (DMSO, as negative control); in dark red: Rapamycin (positive control); in red: RARA agonists that increased significantly SQSTM1 intensity (4HPR is highlighted); in blue: Paxilline; in orange (in sequence): Geranylgeraniol, 6a-fluorotestosterone and 1a,25-dihydroxyvitamin D3 (One-Way ANOVA followed by Sidak´s multiple comparisons test; a complete list of the compounds is available in Table S1). (b) Representative immunolabeling of mTBK1 MNs treated with DMSO (vehicle) and 4HPR (10 μM). (c) Representative confocal images of CTRL and mTBK1 MNs at DIV14 treated with vehicle or 4HPR (1 μM) for 24 h and immunolabeled against CHAT and SQSTM1. 4HPR increases SQSTM1 accumulation in mTBK1 to a higher extent compared to CTRL (two-way ANOVA followed by Holm-Sidak´s multiple comparisons test: *p < 0.05; **p < 0.01; ***p < 0.001). (d and e) Immunoblot analysis of endogenous TBK1 (d) and LC3-II (e) protein levels in CTRL and mTBK1 MNs at DIV14 treated with vehicle or 4HPR (1 μM) for 24 h. (two-way ANOVA followed by Holm-Sidak´s multiple comparisons test: *p < 0.05; **p < 0.01; ***p < 0.001). (f) Representative confocal images of CTRL and mTBK1 MNs transfected with mRFP-EGFP-LC3 construct and treated with 4HPR (1 μM). The autophagy sensor reveals that the retinoid increases the autophagic flux in CTRL cells, while mutant MNs are characterized by an early-phase block in the pathway. Data information: the complete molecule screening was performed twice in N = 2 independent differentiations, and compounds were tested twice each time (n = 120 MNs analyzed). The other experiments were performed in N = 3 independent replicates, and in (f) the lines CTRL I and mTBK1 I were used as representative of the respective genotypes. In immunocytochemistry a minimum of n = 90 CHAT+ cells were analyzed, while the autophagy flux was evaluated in a minimum of n = 16 transfected MNs for each condition. Scale bars: (b) and (f) 5 μm, (c) 10 μm. Data are presented as mean ± SEM.
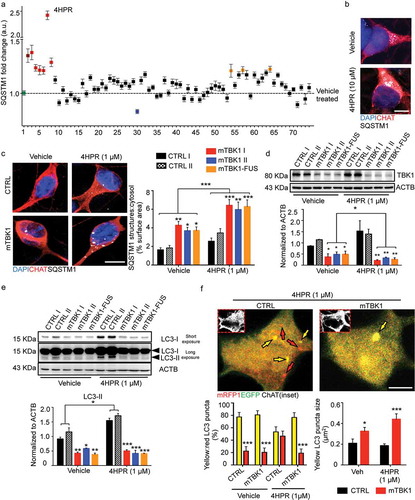
Figure 4. mTBK1 MNs show impaired autophagosome maturation. (a) TEM analysis of CTRL and mTBK1 MNs at DIV14 treated with vehicle or 4HPR (1 μM) for 24 h. White arrowheads indicate Early AVs; black arrowheads indicate Late AVs (autolysosomes); red arrowheads indicate phagophores. mTBK1 MNs show increased cumulative phagophore length and accumulation of phagophores after 4HPR treatment (shown in ai and aii, two-way ANOVA followed by Holm-Sidak´s multiple comparisons test: *p < 0.05; **p < 0.01). 4HPR increases the total number of AVs in CTRL MNs, but not in mTBK1 (shown in aiii, two-way ANOVA followed by Holm-Sidak´s multiple comparisons test: **p < 0.01; ***p < 0.001). (b) TEM analysis of CTRL and mTBK1 MNs at DIV14 treated with vehicle or 4HPR (1 μM) for 48 h. CTRL MNs show large cytosolic vesicles, while mTBK1 accumulate large unorganized double-membrane structures. Data information: in all the experiments a minimum of n = 21 MNs were analyzed (N = 3 independent replicates for 24 h treatment, N = 2 independent replicates for 48 h treatment), and the lines CTRL I and mTBK1 I were used as representative of the respective genotypes. scale bars: (A) 0.25 μm, (b) 1 μm in the low magnifications and 0.5 μm in the higher magnifications. Data are presented as mean ± SEM.
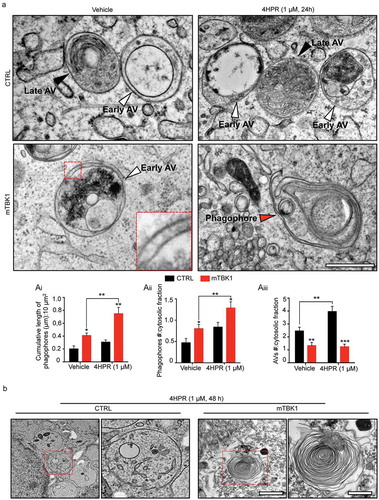
Figure 5. Autophagy blockade in mTBK1 occurs at the elongation phase. (a) Heatmap showing mRNA expression of autophagy genes significantly altered in CTRL and mTBK1 MNs at DIV14 treated with vehicle or 4HPR (1 μM) for 24 h. (b) qRT-PCR analysis of ATG10 and TMEM74 levels (two-way ANOVA followed by Holm-Sidak´s multiple comparisons test: *p < 0.05). (c) Immunoblot analysis of endogenous ATG10 protein levels in CTRL and mTBK1 MNs at DIV14 treated with vehicle or 4HPR (1 μM) for 24 h (two-way ANOVA followed by Holm-Sidak´s multiple comparisons test: ***p < 0.001). (d and e) Immunoblot analysis of endogenous total (d) and phosphorylated (e) SQSTM1 protein levels in CTRL and mTBK1 MNs at DIV14 treated with vehicle or 4HPR (1 μM) for 24 h. mTBK1 show increased baseline levels of SQSTM1, whose accumulation becomes more dramatic upon 4HPR treatment. Levels of Ser403 phosphorylation were increased in CTRL after 4HPR treatment, while in mTBK1 remained downregulated (two-way ANOVA followed by Holm-Sidak´s multiple comparisons test; *p < 0.05; **p < 0.01; ***p < 0.001). (f and g) Representative confocal images of mTBK1 MNs transfected either with GFP reporter or ATG10-GFP vector. Cells were treated with vehicle or 4HPR (1 μM) for 24 (f) or 48 h (g) and immunolabeled against CHAT and SQSTM1 (f) or CYCS (g). Upper row shows GFP-positive signals, lower row shows magnification of the somata. Overexpression of ATG10 rescues the detrimental effect of 4HPR on SQSTM1 accumulation (two-way ANOVA followed by Holm-Sidak´s multiple comparisons test: p = 0.06), and attenuates the 4HPR-dependent increase of CYCS (two-way ANOVA followed by Holm-Sidak´s multiple comparisons test: *p < 0.05). This confirms the beneficial effect on MNs fitness exerted by ATG10 restoration. Data information: all the experiments were performed in in N = 3 independent replicates, and the lines CTRL I and mTBK1 I were used as representative of the respective genotypes. The effect of ATG10 overexpression was evaluated in N = 3 independent replicates analyzing a minimum of n = 16 CHAT+ cells for each group. Scale bars: (f) and (g) 10 μm in the higher row and 5 μm in the lower row. Data are presented as mean ± SEM.
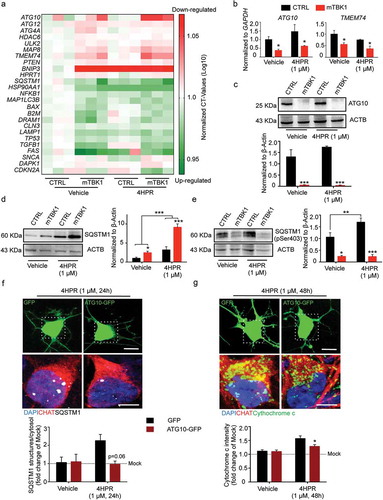
Figure 6. 4HPR leads to ATG10 downregulation and aggresome accumulation in mC9orf MNs. (a and b) Representative confocal images of corrected mFUS (a); CTRL and mC9orf (b) MNs at DIV14 treated with vehicle or 4HPR (1 μM) for 24 h and immunolabeled against CHAT and SQSTM1. 4HPR does not trigger SQSTM1 accumulation in FUS-mutant MNs; in contrast, it induces a strong SQSTM1 accumulation in mC9orf (two-way ANOVA followed by Holm-Sidak´s multiple comparisons test; *p < 0.05). (c) Immunoblot analysis of endogenous ATG10 protein levels in CTRL and C9orf72 (C9orf) MNs at DIV14 treated with vehicle or 4HPR (1 μM) for 24 h (two-way ANOVA followed by Holm-Sidak´s multiple comparisons test: *p < 0.05). (d) TEM analysis of CTRL and mC9orf72 MNs at DIV14 treated with vehicle or 4HPR (1 μM) for 24 h. 4HPR increases in both genotypes the number of AVs (two-way ANOVA followed by Holm-Sidak´s multiple comparisons test; **p < 0.01), which are larger (black arrowheads) in mC9orf MNs (two-way ANOVA followed by Holm-Sidak´s multiple comparisons test; **p < 0.01). 4HPR eventually leads to accumulation of aggresomes in mC9orf MNs (two-way ANOVA followed by Holm-Sidak´s multiple comparisons test; *p < 0.05). Red arrowheads indicate double-membrane structures associated to high-sized AVs and aggresomes. Data information: immunocytochemistry was performed in N = 3 independent replicates and a minimum of n = 60 CHAT+ cells were analyzed. TEM analysis was performed in a minimum of n = 21 MNs from N = 2 independent replicates. Scale bars: (a and b) 10 μm, (d) 1 μm. Data are presented as mean ± SEM.
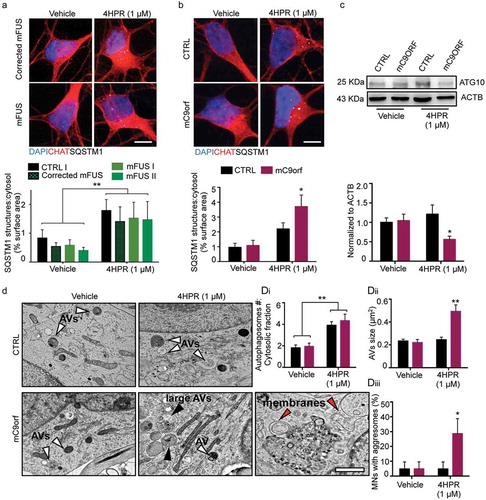
Figure 7. Schematic representation of the autophagy mismatch model in mTBK1 MNs. (a) In the present study we show that due to an impaired autophagic flux, mTBK1 MNs accumulate aberrant cytosolic SQSTM1-positive aggresomes. Treatment with 4HPR induces a mismatch between phagophore formation and the ability of these structures to undergo proper maturation, and this eventually leads to increased MNs death upon prolonged treatment. The mismatch is rescued by re-establishment of ATG10 levels, which also exerts an overall beneficial effect on MNs fitness. (b) Speculative mechanistic hypothesis: in absence of pathogenic mutations TBK1 phosphorylates SQSTM1, which promotes autophagy and sequesters KEAP1 from its interaction partner NFE2L2/NRF2. This releases NFE2L2, which can promote the transcription of autophagy-related genes such as ATG10. In the present study we have shown that ALS-related TBK1 mutations lead to reduced SQSTM1 phosphorylation and impaired autophagy. We speculate (purple frame) that this might disrupt the positive feedback loop orchestrated by SQSTM1 and its interaction with the KEAP1-NFE2L2 complex: lack of SQSTM1 activation might limit KEAP1 degradation and lead to a subsequent reduced release of NFE2L2: as a consequence NFE2L2 transcriptional activity is downregulated leading to a reduced transcription of autophagy genes.
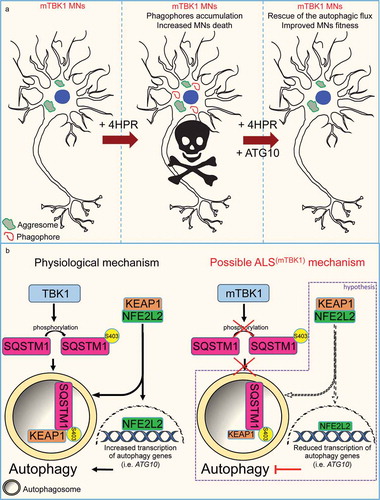
Table 1. Complete list of the primary antibodies used in this study.