Figures & data
Figure 1. Alborixin induced autophagy in N9 cells. (A) Western blot analysis for LC3B-II and SQSTM1 and calculation of autophagy flux after treatment with alborixin at indicated time periods in the absence and presence of bafilomycin A1 in mouse microglial N9 cells. Autophagic flux was calculated through ratio of LC3B-II:ACTB in the absence and presence of bafilomycin A1. (B) Confocal microscopy analysis of N9 cells for GFP-LC3 puncta. LC3 puncta were visualized and counted after 12-h treatment of N9 cells with alborixin (125 nM) and rapamycin (200 nM). The Images shown here are representative of 1 of 3 similar experiments and were taken at 40x. The scale bar in zoomed-out images: 20 μm. The average number of puncta per cells were calculated after analyzing 200 cells from 3 independent experiments (3n). (C) Transmission electron microscopy was used to analyze the formation of autophagosomes in N9 cells, which were treated similarly as in . The scale bars used in zoomed-out and zoomed-in images are shown in the figure. A total of 45 cells were analyzed for counting average number of autophagosomes per cell. Densitometry of western blots was done by using ImageJ software and statistical comparisons were made as shown in the figure by using Bonferroni test. p value<0.05 was considered to be significant with ***p < 0.001, **p < 0.01, *p < 0.05. The images presented in this figure are only representative in nature.
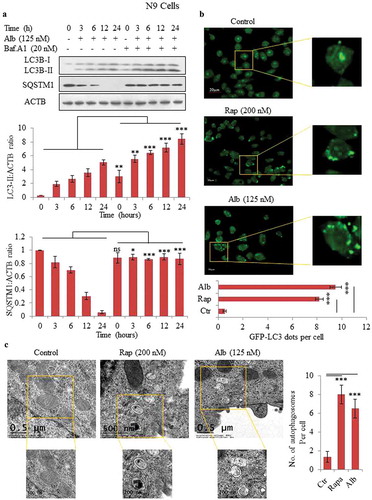
Figure 2. Inhibition of the PI3K-AKT-MTOR pathway via upregulation of PTEN in N9 cells. Alborixin at 125 nM, enhanced the protein level of PTEN in a time-dependent manner to inhibit several downstream proteins viz. p-AKT (S473, T308), p-MTOR (S2448) and RPTOR of AKT pathway in N9 cells. Alborixin also upregulated key autophagic proteins BECN1, ATG7, ATG5 and ATG12 in a time-dependent manner in N9 cells. Western blots of all proteins from 3 independent experiment were quantified by using Quantity One and ImageJ softwares and normalized by dividing with ACTB as shown in the bar graphs.
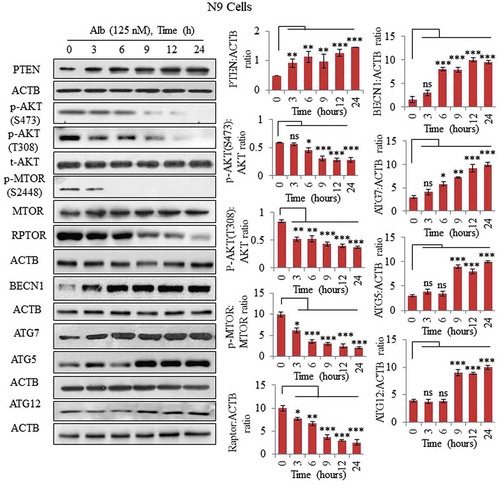
Figure 3. Alborixin induced autophagy in primary neuronal cells by upregulating PTEN. (A) Calculation of autophagy flux in primary neuronal cells. (B) Alborixin treatment upregulated the expression of PTEN and reduced the level of p-AKT (S473, T308), p-MTOR (S2448) along with enhanced level of BECN1, ATG5 and ATG7. Blots from 3 independent experiments were quantified by using quantity one and imageJ softwares and normalized by dividing by ACTB as shown in the bar graphs. The blots shown in this figure are representative images.
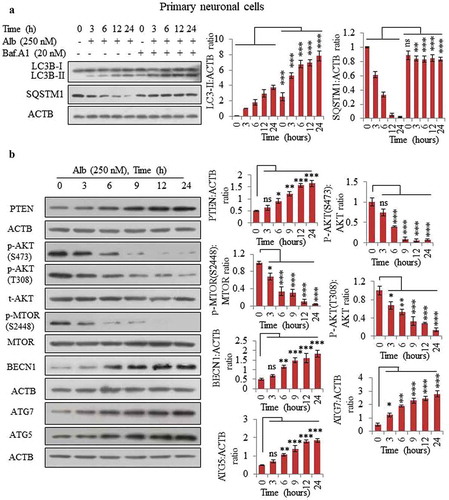
Figure 4. Knocking down of PTEN led to abrogation of alborixin-induced autophagy in HMC3 cells. (A) Western blot analysis of LC3B-II and SQSTM1 in PTEN knocked down HMC3 cells after treatment with alborixin (125 nM) through 24 h. (B) Western blot analysis of LC3B-II and SQSTM1 in wild-type HMC3 cells after treatment with alborixin under similar conditions. Autophagic flux was calculated by using ratio of LC3B-II:ACTB in the absence and presence of bafilomycin A1. (C) Effect of overexpressed WT PTEN and its inactive mutant on autophagy flux in HMC3 cells. Overexpression of PTEN was induced by transfecting the pCMV Flag WT-PTEN plasmid into HMC3 cells, whereas the PTEN mutant was generated by PCR based site-directed mutagenesis. (D) Overexpression of AKT led to abrogation of alborixin-induced autophagy flux in HMC3 cells. For overexpression of AKT, the HMC3 cells were transfected with the Myr-AKT plasmid before treatment with alborixin. Blots presented here are representative only and the quantitative graphs quantified by using ImageJ software shown are mean±SD of 3 independent experiments (3n). Statistical comparisons were made between different samples by using the Bonferroni test as shown in the figure. p value<0.05 was considered to be significant with ***p < 0.001, **p < 0.01, *p < 0.05 or @@@p < 0.001, @@p < 0.01, @p < 0.05.
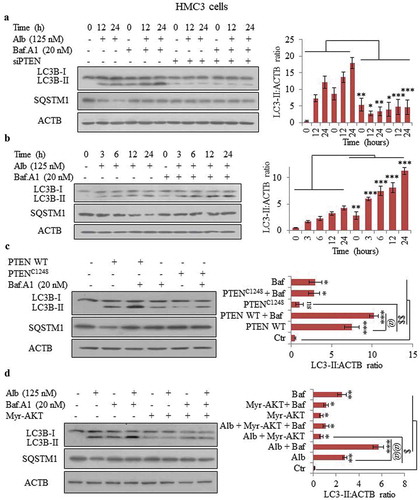
Figure 5. Alborixin enhanced the basal level of autophagy induced by soluble amyloid beta (sAβ) and fAβ. Representative images of transmission electron microscopy (TEM), (A) sAβ and (B) fibrillar amyloid beta (fAβ). Scale bars: (A) 200 nm, (B) 100 nm. (C and D) Level of LC3B-II was increased and that of SQSTM1 was reduced after co-treatment of N9 cells with either soluble or fibrillar forms of Aβ and alborixin 125 nM. Bafilomycin A1 (20 nM) reversed the effect of alborixin. Rapamycin (200 nM) in this experiment was used as a standard. Autophagic flux was calculated by using LC3B-II:ACTB in the absence and presence of bafilomycin A1. Ratio of values obtained through densitometry of western blots were quantified by using ImageJ software. Data presented here are mean±SD of 3 independent experiments and the blots shown in this figure are representative images. Statistical comparisons were made between samples treated with either sAβ or fAβ and all other samples by using Bonferroni test. p values ***p < 0.001, **p < 0.01, *p < 0.05.
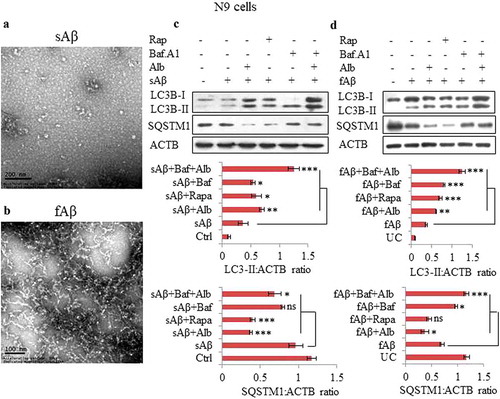
Figure 6. Alborixin facilitated the clearance of Aβ in N9 and primary neuronal cells. (A) Confocal images of N9 cells treated with Aβ and alborixin (125 nM) for 12 h. (B) Relative fluorescence intensity (RFI) of confocal images. Scale bars: 5 μm (Figure 6A), and μm (). (C and D) Confocal microscopy and calculation of RFI in primary neuronal cells treated with alborixin (250 nM) for 24 h, whereas, Aβ was added 12 h before termination of the experiment. Rapamycin (200 nM) in all the experiments was used as a standard. Red fluorescence of Aβ1-42-HiLyte Fluor 555 was considerably reduced in cells treated with alborixin. Bafilomycin A1 (20 nM) on the contrary reduced the clearance of Aβ. For each sample, average RFI of at least 500 cells was taken and then final average was calculated for the same sample from 3 independent experiments (3n) by using FV-10-ASW (Version 1.7) software. (E) ELISA of N9 cells treated under similar conditions to quantify Aβ present intracellularly and in the supernatant. (F) Flow cytometric analysis for clearance of Aβ in N9 cells treated under similar conditions as in Figure 6A. However, for flow cytometry, fluorochrome tagged Aβ1–42-HiLyte Fluor 488 was used. Flow cytometric histograms shown here are representative images from 1 of 3 similar experiments. Average of 3 experiments (3n) is depicted in the graph as Figure 6G. Samples were compared statistically by using Bonferroni test. p value ***p < 0.001, **p < 0.01, *p < 0.05 or @@@p < 0.001, @@p < 0.01, @p < 0.05.
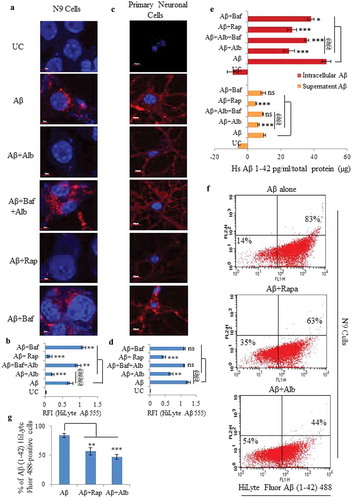
Figure 7. Effect of alborixin on clearance of fibrillar form of Aβ in N9 cells. (A and B) Cells after treatment with fAβ (10 μM) and alborixin (125 nM) or rapamycin (200 nM), were stained with thioflavin S (0.1%) for 10 min before analysis on a confocal microscope at 60x and (C) flow cytometry. Cells treated with both rapamycin and alborixin displayed reduced green fluorescence of stained fAβ. Scale bar for confocal images: 5 µm for zoomed-in and 20 µm for zoomed-out images. A total of 500 cells were analyzed for calculating average fluorescence intensity (RFI) from 3 independent experiments (3n). Statistical comparisons in all the experiments were made as shown in the figures by using Bonferroni test. p values ***p < 0.001, **p < 0.01, *p < 0.05 or @@@p < 0.001, @@p < 0.01, @p < 0.05.
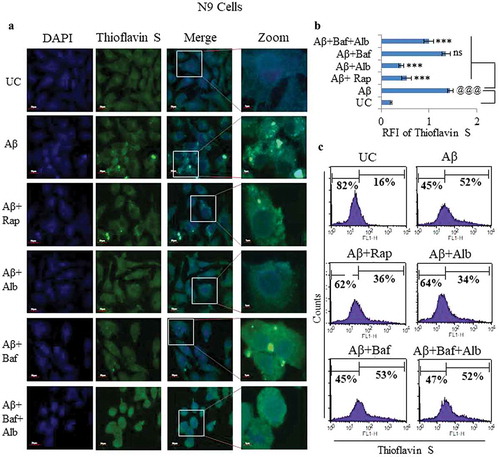
Figure 8. Knockdown of PTEN and overexpression of AKT reversed the clearance of Aβ caused by alborixin. (A) Confocal microscopy and flow cytometric analysis for clearance of amyloid beta (Aβ1-42-HiLyte Fluor 555) in siPTEN-transfected and alborixin-treated HMC3 cells. (B) Analysis for Aβ clearance in Myr-AKT delta4-129-transfected HMC3 cells after treatment with alborixin. (C) WT PTEN overexpression independent of alborixin caused clearance of Aβ, whereas, the catalytically inactive mutant PTENC124S did not have any effect on the clearance of Aβ in HMC3 cells. Confocal images of HMC3 cells were taken after treatment with Aβ and alborixin (125 nM) for 12 h. Average RFI of at least 500 cells was used to calculate final average for the same sample from 3 independent experiments (3n). Scale bar used in confocal images: 10 µm. The X axis of dot plots in Figure 8A-C represents Aβ1-42-HiLyte Fluor 555 fluorescence. Statistical comparisons for Figure 8A-C were made by using Bonferroni test. p values ***p < 0.001, **p < 0.01, *p < 0.05 or @@@p < 0.001, @@p < 0.01, @p < 0.05.
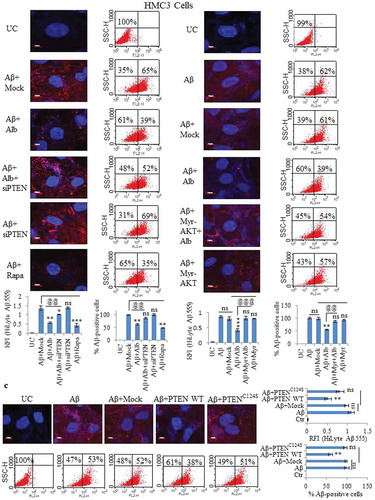
Figure 9. Alborixin caused clearance of Aβ through formation of autolysosomes in N9 cells. (A) Double staining of cells with LysoTracker DND Red (80 nM) and Aβ1-42-HiLyte fluor 488 (2 μg/ml) showed reduced level of Aβ with increasing LysoTracker DND Red fluorescence after treatment with alborixin. However, red fluorescence was highly reduced, when, cells were co-treated with alborixin and bafilomycin A1 (20 nM). (B) Immunofluorescence staining of N9 cells against LAMP1 in presence of Aβ1-42-Hilyte Fluor 488 and DAPI. For both representative Figure 9A and B, RFI was calculated from at least 500 cells from each sample and then final average RFI of each sample was calculated from 3 independent experiments (3n), the data are given in Figure 9C & D. Scale bar for confocal images: 5 µm for zoomed-in images. Statistical comparisons in all the experiments were made as shown in the figures by using Bonferroni test. p values ***p < 0.001, **p < 0.01, *p < 0.05 or @@@p < 0.001, @@p < 0.01, @p < 0.05.
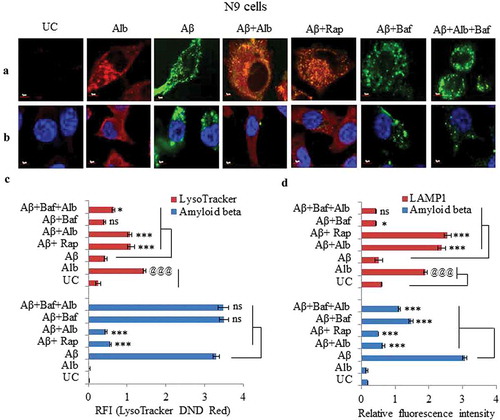
Figure 10. Knocking down of Atg5 and Becn1 led to reduced clearance of Aβ in N9 cells. (A) Confocal microscopy images after various treatments of N9 cells with siRNA-mediated knocked down of Atg5. Histogram shows the average RFI of Aβ1-42-HiLyte Fluor 555 for each sample from 3 independent experiments. (B) Flow cytometric analysis of N9 cells treated under similar conditions as in Figure 10A. Histogram represents average of % Aβ1-42-hilyte fluor 555-positive cells from 3 separate experiments (3n). (C) Confocal microscopy and average RFI of Aβ1-42-hilyte fluor 555 in Becn1-knocked down N9 cells after treatment with alborixin. Average RFI of Aβ1-42-hilyte fluor 555 was measured from 3 independent experiments (3n) is shown in the histogram. (D) Flow cytometric analysis for clearance of Aβ in siBecn1-transfected N9 cells. Average number of Aβ1-42-hilyte fluor 555-positive cells from 3 independent experiments are shown in the histogram. Scale bar for confocal images: 20 µm. Bonferroni test was applied for statistical comparisons between samples as shown in the figures. p values ***p < 0.001, **p < 0.01, *p < 0.05 or @@@p < 0.001, @@p < 0.01, @p < 0.05.
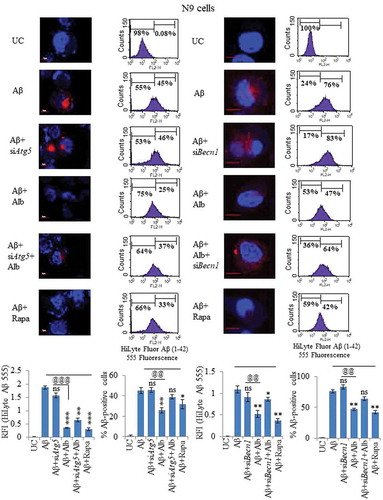
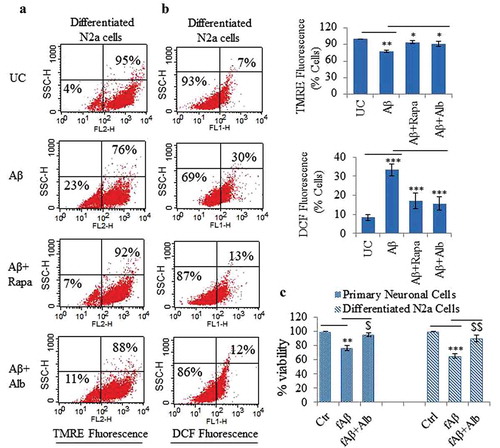
Figure 11. Alborixin provided neuroprotection against Aβ1-42 in differentiated neuroblastoma and primary neuronal cells. (A) Flow cytometric analysis for mitochondrial membrane potential in differentiated N2a cells by using TMRE dye. Alborixin rescued the cells from Aβ induced mitochondrial stress as indicated by increased number of TMRE fluorescent cells in comparison to cells treated with Aβ alone. (B) Analysis for ROS generation by flow cytometry. N2a cells were treated similarly as for mitochondrial potential analysis. ROS generation was captured by using DCFH2-DA, which produced green fluorescence after interaction with ROS. As indicated by dot plot, alborixin considerably reduced the ROS generation induced by Aβ. The histograms in Figure 11A and B represent the average number of TMRE- or DCF-positive cells from 3 independent experiments for each sample. (C) Alborixin rescued primary neuronal and differentiated N2a cells from Aβ cytotoxicity. Cells treated with Aβ1-42 for 48 h were checked for their viability through an SRB assay. Alborixin (250 nM) was added to cells 24 h before termination of the experiment. Bonferroni test was applied for statistical comparisons between different samples as shown in the figures. p values ***p < 0.001, **p < 0.01, *p < 0.05 or @@@p < 0.001, @@p < 0.01, @p < 0.05.