Figures & data
Figure 1. Expression of FAD-PSEN2 mutants blocks autophagy. (a) Representative western blot for LC3-I, LC3-II and PSEN2 (left) and quantification (right) of LC3-II basal levels (normalized to ACTB levels) in SH-SY5Y cells (control and PSEN2T122R-expressing). Mean ± SEM, n = 4 independent experiments. **p < 0.01. (b) Left, representative confocal images of SH-SY5Y cells (control and PSEN2T122R-expressing) co-transfected with a GFP-LC3 cDNA. Green dots represent autophagosomes at basal conditions. Scale bar: 10 µm. Right, quantification of GFP-LC3 dots in the different cell types. Mean ± SEM, n = 45 and 16 cells for control and PSEN2T122R-expressing, respectively, from 3 independent experiments. **p < 0.01. (c) SH-SY5Y cells (control and PSEN2T122R-expressing) were incubated for 1 h at 37°C with complete medium (DMEM + 10% FCS; fed) or with an extracellular solution supplemented with 1 mM CaCl2 (starv), in the absence or presence of BafA (100 nM). Endogenous LC3 (LC3-I and LC3-II) and PSEN2 levels are shown in a representative western blot (left) and levels of LC3-II (normalized to ACTB) are quantified in the different conditions (right). Mean ± SEM, n = 9 independent experiments. *p < 0.05; **p < 0.01. (d) SH-SY5Y cells (control and PSEN2T122R-expressing, co-transfected with mitochondrial RFP to select transfected cells) were treated as in (c) and immuno-stained for endogenous LC3. Representative confocal images (left) and LC3 dots quantification (right) are shown. Scale bar: 10 µm. Mean ± SEM, n = 60–90 cells, from 4 independent experiments. (e) Primary human fibroblasts (from a heathy control, and a FAD-PSEN2N141I subject; see Materials and Methods) were treated as in (c) and immuno-stained for endogenous LC3. Representative images (left) and LC3 dots quantification (right) are shown. Scale bar: 10 µm. Mean ± SEM, n = 18–29 cells, from 3 independent experiments. *p < 0.05; **p < 0.01; ***p < 0.001.
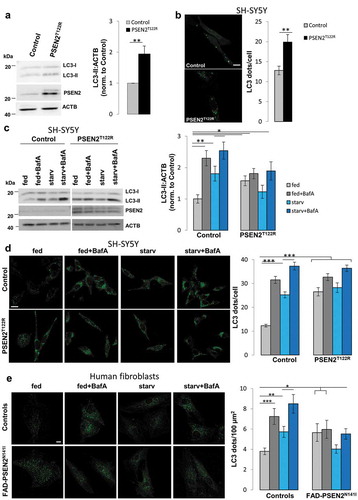
Table 1. Autophagosome size is increased in FAD-PSEN2 expressing cells.
Figure 2. Expression of FAD-PSEN2T122R induces a blocks in the autophagy flux. (a and b) SH-SY5Y cells (control or PSEN2T122R-expressing) transfected with cDNA for the mCherry-GFP-LC3 probe were (a) incubated, or not (not-treated, NT), with BafA (100 nM) for 8 h, or (b) left for 2 h in complete medium (fed) or extracellular saline (starv), and analyzed by confocal microscopy for GFP (Ex, 488 nm) and mCherry (Ex, 555 nm) fluorescence (see Fig. S4 for single fluorescence images). Representative confocal images (left) are shown; white dots represent GFP+, RFP+ vesicles, thus autophagosomes, while red dots represent autolysosomes. Scale bar, 10 µm. Histograms (right) represent white dot (GFP+, RFP+) quantification over total dots [(GFP+, RFP+) plus RFP+]. Mean ± SEM, n = 29–65 cells, from 3 independent experiments. ***p < 0.001. (c) Representative confocal images and relative quantification of SH-SY5Y cells (control or PSEN2T122R-expressing) transfected with the EGFP-HDQ74 cDNA and incubated, or not (not-treated, NT), with BafA (100 nM) for 2 h, as indicated. The percentage of cells displaying EGFP-HDQ74 aggregates (indicated by arrows) was calculated (right). Cells without aggregates are marked by dotted ROIs. Scale bar: 10 μm. Mean ± SEM, n = 90–230 cells from 3 independent experiments. *p < 0.05; **p < 0.01.
![Figure 2. Expression of FAD-PSEN2T122R induces a blocks in the autophagy flux. (a and b) SH-SY5Y cells (control or PSEN2T122R-expressing) transfected with cDNA for the mCherry-GFP-LC3 probe were (a) incubated, or not (not-treated, NT), with BafA (100 nM) for 8 h, or (b) left for 2 h in complete medium (fed) or extracellular saline (starv), and analyzed by confocal microscopy for GFP (Ex, 488 nm) and mCherry (Ex, 555 nm) fluorescence (see Fig. S4 for single fluorescence images). Representative confocal images (left) are shown; white dots represent GFP+, RFP+ vesicles, thus autophagosomes, while red dots represent autolysosomes. Scale bar, 10 µm. Histograms (right) represent white dot (GFP+, RFP+) quantification over total dots [(GFP+, RFP+) plus RFP+]. Mean ± SEM, n = 29–65 cells, from 3 independent experiments. ***p < 0.001. (c) Representative confocal images and relative quantification of SH-SY5Y cells (control or PSEN2T122R-expressing) transfected with the EGFP-HDQ74 cDNA and incubated, or not (not-treated, NT), with BafA (100 nM) for 2 h, as indicated. The percentage of cells displaying EGFP-HDQ74 aggregates (indicated by arrows) was calculated (right). Cells without aggregates are marked by dotted ROIs. Scale bar: 10 μm. Mean ± SEM, n = 90–230 cells from 3 independent experiments. *p < 0.05; **p < 0.01.](/cms/asset/5e448404-7f5a-4157-a88c-1483d47f5731/kaup_a_1596489_f0002_oc.jpg)
Table 2. Lysosome size is increased in FAD-PSEN2 expressing cells.
Figure 3. Expression of FAD-PSEN2 impairs autophagosome-lysosome fusion. (a) SH-SY5Y cells (control or PSEN2T122R-expressing, co-transfected with a nuclear CFP to select transfected cells) were incubated for 2 h with complete medium (fed) or extracellular saline (starv). Cells were immuno-stained for endogenous LC3 and LAMP1 (secondary Alexa Fluor 488 and Alexa Fluor 555 conjugated antibodies were used, respectively) and visualized by confocal microscopy. Merged images are shown (left) together with Manders’ M2 co-localization coefficient and the proportion of double positive LC3+LAMP1+ dots over total LC3+ dots (right), for each condition. Scale bar, 10 µm. Mean ± SEM, n = 30–37 cells, from 3 independent experiments. *p < 0.05; **p < 0.01. (b) Primary human fibroblasts (from a healthy and a FAD-PSEN2N141I subject) were incubated, or not (not-treated, NT), with BafA (100 nM) for 2 h, and immuno-stained for endogenous LC3 and LAMP1. Representative confocal images (left) and Manders’ M2 co-localization coefficient and the proportion of double positive LC3+LAMP1+ dots over total LC3+ dots (right) are presented for each condition. Scale bar, 10 µm. Mean ± SEM, n = 21–38 cells, from 3 independent experiments. *p < 0.05; **p < 0.01; ***p < 0.001.
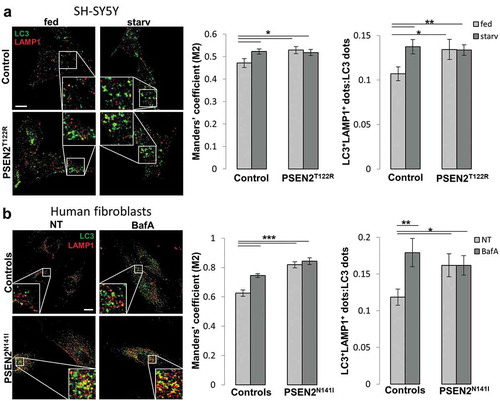
Figure 4. Expression of FAD-PSEN2 affects RAB7 recruitment to autophagic vesicles. (a and b) SH-SY5Y cells (control or PSEN2T122R-expressing, co-transfected with a mitochondrial RFP to select transfected cells) were incubated for 2 h with complete medium (fed) or extracellular saline (starv) and immuno-stained for endogenous RAB7 and LC3 (a) or endogenous RAB7 and LAMP1 (b). Secondary Alexa Fluor 488 and Alexa Fluor 647 conjugated antibodies were used, respectively. Single confocal images were collected separately and the merged ones (left) together with the Pearson’s co-localization coefficient and the proportion of double positive LC3+RAB7+ (or LAMP1+RAB7+) dots over total LC3+ (or LAMP1+) dots (right) are shown for each condition, as indicated. Scale bar, 10 µm. Mean ± SEM, n = 23–34 cells, from 3 independent experiments. *p < 0.05; **p < 0.01; ***p < 0.001.
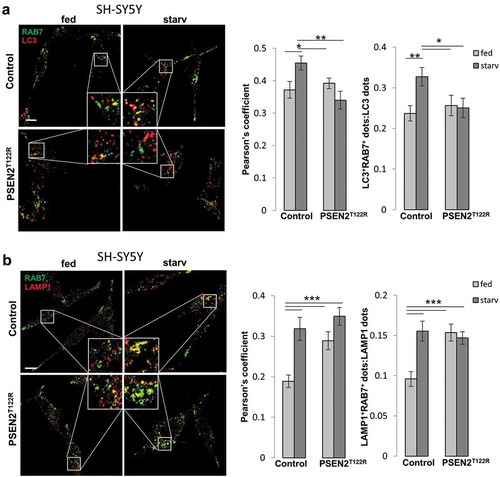
Figure 5. Autophagy flux is impaired by MFN2 ablation and PSEN2T122R expression. (a and b) MEFs (a) wt or (b) mfn2−/− (control or PSEN2T122R-expressing) were transfected with cDNA for the mCherry-GFP-LC3 probe and incubated, or not (not-treated, NT), with BafA (100 nM) for 8 h (left), or subjected, or not, to starvation for 2 h (right). Cells were then analyzed by confocal microscopy for GFP (Ex, 488 nm) and mCherry (Ex, 555 nm) fluorescence. Representative confocal images (white and red dots represent autophagosomes and autolysosomes, respectively) and quantification of white dots (GFP+RFP+) over total dots [(GFP+RFP+) plus RFP+] are shown. Scale bar, 20 µm. Mean ± SEM, n = 28–61 cells, from 3 independent experiments. *p < 0.05; **p < 0.01; ***p < 0.001.
![Figure 5. Autophagy flux is impaired by MFN2 ablation and PSEN2T122R expression. (a and b) MEFs (a) wt or (b) mfn2−/− (control or PSEN2T122R-expressing) were transfected with cDNA for the mCherry-GFP-LC3 probe and incubated, or not (not-treated, NT), with BafA (100 nM) for 8 h (left), or subjected, or not, to starvation for 2 h (right). Cells were then analyzed by confocal microscopy for GFP (Ex, 488 nm) and mCherry (Ex, 555 nm) fluorescence. Representative confocal images (white and red dots represent autophagosomes and autolysosomes, respectively) and quantification of white dots (GFP+RFP+) over total dots [(GFP+RFP+) plus RFP+] are shown. Scale bar, 20 µm. Mean ± SEM, n = 28–61 cells, from 3 independent experiments. *p < 0.05; **p < 0.01; ***p < 0.001.](/cms/asset/bbf41e03-717a-4884-b449-ccfb8feb8472/kaup_a_1596489_f0005_oc.jpg)
Figure 6. Partial depletion of ER Ca2+ content mimics the autophagy defect induced by FAD-PSEN2 expression. (a) Representative western blot (left) and quantification (right) of LC3 basal levels (normalized to ACTB) in SH-SY5Y cells (control or PSEN2T122R-expressing) transfected with scramble (scr-siRNA) or anti-ATP2A/SERCA (ATP2A/SERCA-siRNA) siRNAs. Mean ± SEM, n = 4 independent experiments. *p < 0.05; **p < 0.01. (b) Representative images and quantification of LC3 dots, revealed by immuno-staining, in SH-SY5Y cells transfected with the indicated siRNAs and treated, or not (not-treated, NT), with BafA (100 nM; 2 h). Mean ± SEM, n = 26–51 cells, from 3 independent experiments. ***p < 0.001. (c) Representative images and quantification of endogenous RAB7 and LC3-GFP co-localization (Pearson’s coefficient) in SH-SY5Y cells (control or PSEN2T122R-expressing) transfected as in (a) and incubated with complete medium (fed) or extracellular saline (starv) for 2 h. Mean ± SEM, n = 14–34 cells, from 3 independent experiments. *p < 0.05; **p < 0.01. (d) Quantification of LC3 dots, revealed by immuno-staining, in SH-SY5Y cells treated, or not (NT), with BAPTA-AM or EGTA-AM (5 µM) for 3 h, or EGTA (2 mM) over night (on), in the presence, or not, of BafA (100 nM). Mean ± SEM, n = 20–53 cells, from 3 independent experiments. ***p < 0.001.
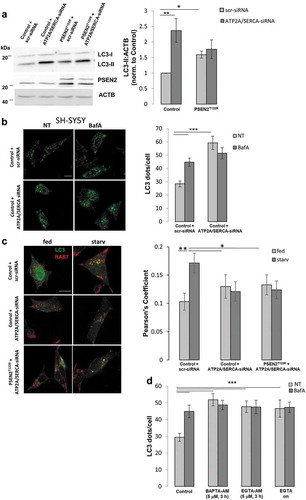
Figure 7. Cytosolic Ca2+ signal is essential in mediating the autophagy defect induced by FAD-PSEN2 expression. (a) Representative images and quantification of LC3 dots, revealed by immuno-staining, in SH-SY5Y cells incubated, or not (control), with BAPTA-AM or EGTA-AM (2 μM, 1 h) and treated, or not (not-treated, NT) with BafA (100 nM). Mean ± SEM, n = 26–51 cells, from 3 independent experiments. *p < 0.05; ***p < 0.001. (b and c) SH-SY5Y cells were incubated with, or without (control), BAPTA-AM (2 μM) for 1 h in complete medium (fed) or extracellular saline (starv). Cells were immuno-stained for (b) endogenous RAB7 and LC3 or (c) endogenous RAB7 and LAMP1. Merged images (left) together with the Pearson’s co-localization coefficients (right) and the proportion of double positive LC3+RAB7+ (or LAMP1+RAB7+) dots over total LC3+ (or LAMP1+) dots are shown, for each condition. Scale bar, 10 µm. Mean ± SEM, n = 25–33 cells, from 3 independent experiments. *p < 0.05; **p < 0.01; ***p < 0.001.
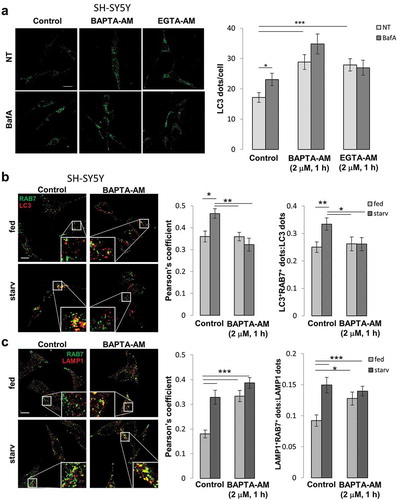
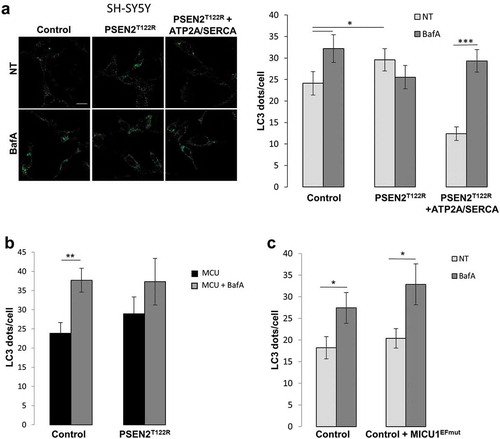
Figure 8. Mitochondrial Ca2+ signal is not involved in mediating FAD-PSEN2-induced autophagy defects. (a–c) Representative images and quantification of LC3 dots, revealed by immuno-staining, in SH-SY5Y cells, control or expressing the indicated proteins (PSEN2T122R and ATP2A/SERCA, (a); PSEN2T122R and MCU, (b); MICU1EFmut, (c)), and treated, or not (not-treated, NT) with BafA (100 nM; 2 h). Mean ± SEM, n = 18–23 cells, from 3 independent experiments. *p < 0.05; **p < 0.01; ***p < 0.001.