Figures & data
Figure 1. Detection and monitoring of autophagy in hemocytes of C. gigas by flow cytometry. (A) FL1 histogram overlay of hemocytes stained with Cyto ID® in normal condition (at T0) and presenting signs of autophagy inhibition (NH4Cl condition). The horizontal axis represents the fluorescence intensity, while the vertical axis represents the number of hemocytes. Based on Cyto ID® staining, two populations are defined: a negative cell population situated on the left of the histogram, and a positive cell population situated on the right of the histogram and only observed in the induced condition. (B) Ratios between percentages of hemocytes with autophagosomes in the different test conditions (control, NH4Cl, carbamazepine, carbamazepine+NH4Cl) after 24 or 48 h to those at T0. Values are means of nine replicates, and error bars represent standard deviation. a: significant difference between a treatment and the control condition at the respective time (p < 0.01). b: significant difference between control conditions at different times (p < 0.01). c: significant difference between a treatment and the NH4Cl condition at the respective time (p < 0.01). The red line represents the basal level of autophagy (T0 condition). (C) Forward scatter (FSC) vs. side scatter (SCC) density plot distinguishing 3 hemocyte populations. In order to define the hemocyte populations, 30,000 events were counted. Group I corresponds to hemocytes with low complexity and size, group II corresponds to hemocytes with moderate size and complexity, and group III corresponds to hemocytes with high complexity and size. (D) Proportion of hemocytes represented by each of the 3 populations at T0 and after 24 or 48 h post-exposure with different reagents (NH4Cl and/or carbamazepine). The control condition represents oysters only in seawater, without reagents. (E) Proportion of hemocytes represented by each of the 3 populations labelled with Cyto ID® at T0 and after 24 or 48 h post-exposure with different reagents (NH4Cl and/or carbamazepine). Values are means of 9 replicates, and error bars represent standard deviation. a: significant difference among respective cell populations relative to proportions of population I cells (p ≤ 0.0001). b: significant difference among respective cell populations relative to proportions of population II cells (p ≤ 0.0001). c: significant difference among respective cell populations relative to the control condition (p ≤ 0.05). d: significant difference among respective cell populations relative to T0 (p ≤ 0.05).
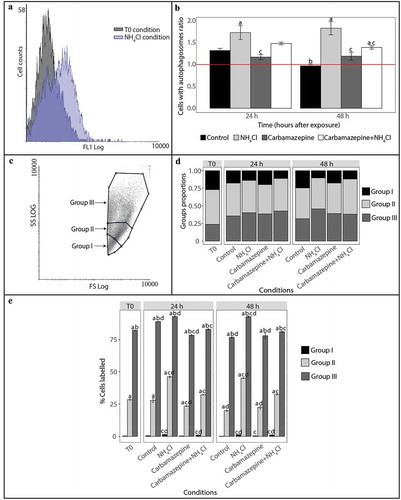
Figure 2. Observation and measurement of the fluorescence intensity of hemocytes stained with Cyto ID®. (A) Difference in the mean fluorescence intensity of hemocytes stained with Cyto ID® between each condition at different times and T0. Each blue cross represents the difference in the mean fluorescence intensity of the hemocytes of the selected condition. The red line represents the difference in the mean fluorescence intensity of hemocytes from that at T0. Gray stars represent outliers. Each boxplot was made with n = 30; * p ≤ 0.01. (B) Hemocyte pictures from different test conditions (NH4Cl, carbamazepine, carbamazepine+NH4Cl, and control) labelled with Cyto ID® (FITC) (column 3) and counterstained with DAPI (4′,6-diamidino-2-phenylindole) (blue) (column 2). A combined image merging results with DAPI and FITC is presented in column 4. The edges of hemocytes can be observed in white light (DIC) (column 1). White arrows show the accumulation of autophagosomes in the hemocytes’ cytoplasm. Scale bar: 10 µm.
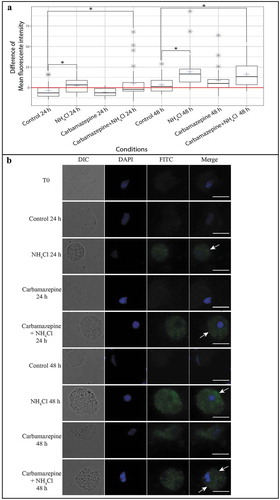
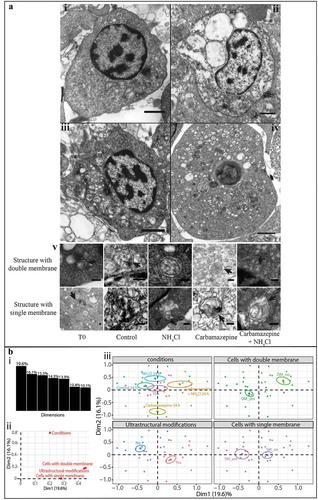
Figure 3. Detection of autophagic structures in hemocytes by transmission electron microscopy. (A) TEM observations of morphological modifications and autophagic structures in hemocytes of C. gigas; scale bar: 1 µm. i. hemocytes without ultrastructural modification (control condition); ii. hemocytes exposed to carbamazepine+NH4Cl presenting ultrastructural modifications; iii. hemocytes treated with an inhibitor of autophagy (NH4Cl) presenting autophagic structures; iv. hemocytes treated with an inducer of autophagy (carbamazepine) presenting autophagic structures. v. autophagic structures with double- or single-membrane-bound structures in all of the different conditions tested; scale bar: 200 µm. Arrow: presence of the double- or single-membrane-bound structure. (B) Results of the MCA of the different variables examined with the TEM approach. i. histogram of the percentages of variances explained by each dimension of the MCA; ii. variables’ contributions to each of the two first dimensions; iii. MCA plot representation of the tested variable (cells with double- or single-membrane-bound structures, changed ultrastructural state, and condition).