Figures & data
Figure 1. Impaired anti-tumor CD4+ T-cell priming in Atg5-deficient dendritic cells. (a) Experimental scheme for B. (b) Atg5± or atg5−/- chimera mice were inoculated subcutaneously with live EG7 cells on day 0. The mice were treated with systemic oxaliplatin on day 8. On day 13, CD4+ T cells and CD8+ T cells from draining lymph nodes were co-cultured with wild-type splenocytes as antigen-presenting cells in the presence or absence of SERPINB/OVA protein for 72 h. Concentrations of IFNG/IFN-γ in the culture medium were measured by ELISA. Mean concentrations are presented with standard deviations (ND: not detected; Student’s t-test, **P < 0.01). Data are representative of 3 independent experiments. (c) Experimental scheme for D. (d) CFSE-labeled OT-II CD4+ T cells were adoptively transferred into Atg5+/- or atg5−/- chimeras on day −1, and then apoptotic EG7 cells were injected into the footpads of mice on day 0. After 64 h, CFSE dilution was measured with flow cytometry. Data are representative of 2 independent experiments. (E) Atg5f/f or ITGAX/CD11c-atg5−/- mice were treated with systemic oxaliplatin 8 days after live EG7 subcutaneous inoculation. After 5 days of oxaliplatin treatment, CD4+ T cells from draining lymph nodes were co-cultured with wild-type splenocytes as antigen-presenting cells in the presence or absence of SERPINB/OVA protein for 72 h. Total amount of IFNG/IFN-γ in the culture supernatant was measured by ELISA. Mean concentrations are presented with SDs (Student’s t-test; ***P < 0.001). Data are representative of 3 independent experiments. (F) CFSE-labeled OT-II CD4+ T cells were adoptively transferred into Atg5f/f or ITGAX/CD11c-atg5−/- mice on day −1, and γ-ray–irradiated EG7 were then injected into the footpads of mice on day 0. CFSE dilution was measured by flow cytometry 64 h after irradiated EG7 injection. Data are representative of 3 independent experiments.
Figure 2. Effect of Atg5 deficiency and PtdIns3K inhibitor treatment on CD8+ T-cell priming and MHC class I presentation. (a) Wild-type BMDCs were pre-incubated with LY294002 and then co-cultured with irradiated EG7 cells and OT-I CD8+ T cells. Concentrations of IFNG/IFN-γ in the culture medium were measured by ELISA. Mean concentrations are presented with standard deviations (Student’s t-test; *P < 0.05). Data are representative of 3 similar independent experiments. (b) Atg5± or atg5−/- NLDCs were co-cultured with irradiated EG7 cells and OT-I CD8+ T cells. After 72 h, concentrations of IFNG/IFN-γ in supernatant were measured by ELISA. Data are representative of 3 similar experiments. (c) Atg5+/- or atg5−/- NLDCs were co-cultured with irradiated EG7 cells. After 24 h, SERPINB/OVA-specific MHC class I antigen presentation was measured by antibody for SERPINB/OVA257-264 (SIINFEKL) peptide bound to H-2Kb. (d) Dot graph showing data pooled from 4 independent experiments. Error bars indicate the standard error of the mean.
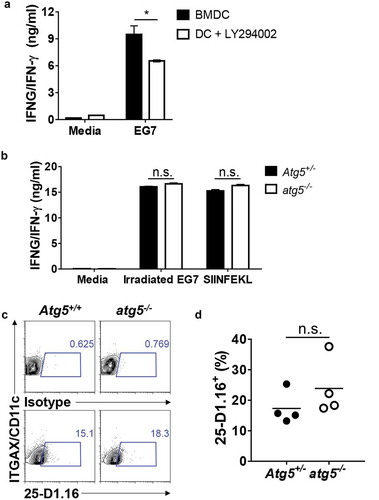
Figure 3. Comparison of dendritic cell DC infiltration into tumor mass. Atg5f/f or ITGAX/CD11c-atg5−/- mice were inoculated subcutaneously with live EG7 cells. Dendritic cells in the tumor-draining lymph nodes (a) or tumor-infiltrated dendritic cells (c) were analyzed with flow cytometry 15 days after tumor inoculation. (b and d) Dot graph showing the frequency and absolute cell number of dendritic cells. Data are representative of 3 similar experiments.
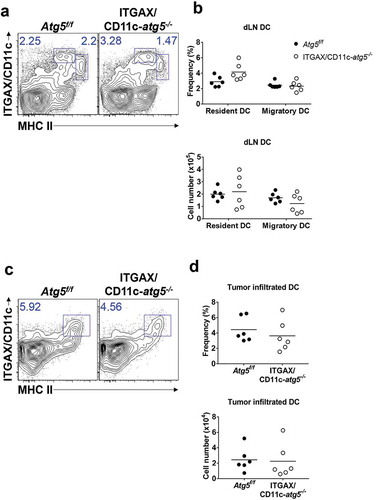
Figure 4. Increased phagocytosis of apoptotic tumor cells in dendritic cells. (a and b) Atg5f/f or ITGAX/CD11c-atg5−/- BMDCs were co-cultured with DiI-labeled apoptotic EG7 cells for 3 h (a) or fluorochrome-labeled latex beads for 1 h (b). Uptake of DiI-labeled apoptotic tumor cells by BMDCs was determined by flow cytometry (c and d). Graph showing the frequency of phagocytosis in DiI-labeled apoptotic tumor cells (c) or latex beads (d) of dendritic cells (Student’s t-test; **P < 0.01). The results shown are representative of 3 similar independent experiments. (e) The footpads of Atg5f/f or ITGAX/CD11c-atg5−/- mice were injected with DiI-labeled apoptotic EG7 cells. After 24 h, the draining lymph node was isolated and phagocytosis of apoptotic tumor cells in migratory (ITGAX/CD11c+ MHC class IIhi) or resident dendritic cells (ITGAX/CD11c+ MHC class IIint) was monitored by flow cytometry. (f) Dot graph showing the frequency of DiI-positive dendritic cells in the draining lymph nodes (4 mice per group; Student’s t-test; **P < 0.01). Data are representative of 3 similar independent experiments.
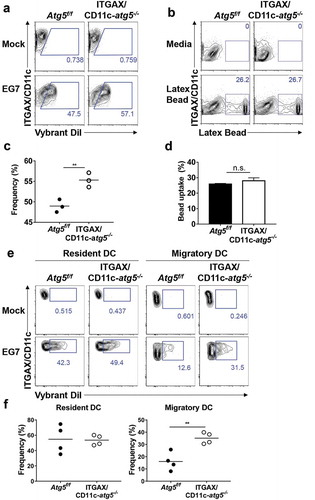
Figure 5. Elevated phagocytosis in Atg5-deficient dendritic cells is not due to change protein degradation activity. (a) Atg5f/f or ITGAX/CD11c-atg5−/- BMDCs were co-cultured with DiI-labeled apoptotic EG7 cells. At the indicated time points, phagocytosis of apoptotic tumor cells was monitored with flow cytometry. (b) Dot graph showing the frequency of phagocytosis in DiI-positive dendritic cells over time. (c) Total proteins from Atg5f/f or ITGAX/CD11c-atg5−/- BMDCs were isolated with cell lysis buffer. Proteolytic activity in total proteins was detected with an EnzCheK protease assay kit.
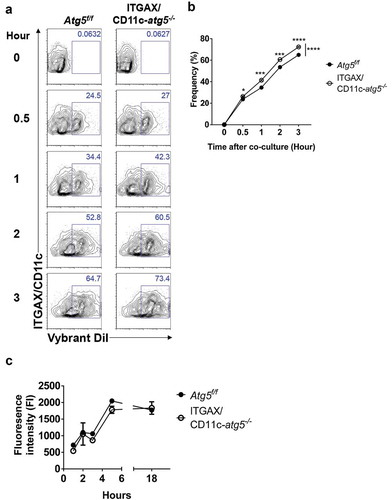
Figure 6. Elevated CD36 expression in Atg5-deficient dendritic cells in vivo. (a) Surface CD36 expression in migratory dendritic cells from draining lymph nodes of normal Atg5f/f (red) or ITGAX/CD11c-atg5−/- mice (blue) monitored with flow cytometry. Isotype control used as a negative control (gray). (b) Data shown in dot graph (5 mice per group; *P < 0.05). (c) Surface CD36 expression in tumor-infiltrated dendritic cells from tumor-bearing Atg5f/f (red) or ITGAX/CD11c-atg5−/- mice (blue). (d) Data shown in dot graph (5 mice per group; **P < 0.05). Data are representative of 3 similar independent experiments.
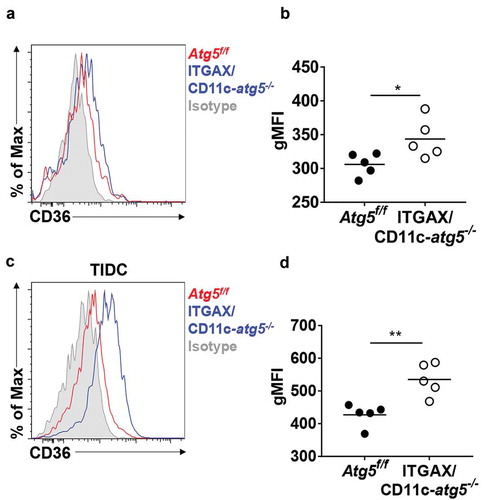
Figure 7. Increased lipid accumulation in Atg5-deficient dendritic cells in vivo. (a) Total amount of lipids in migratory dendritic cells from draining lymph nodes of normal Atg5f/f (red) or ITGAX/CD11c-atg5−/- mice (blue) were stained with BODIPY dye and monitored with flow cytometry. Unstained sample was used as negative control (gray). (b) Data shown in dot graph (5 mice per group; *P < 0.05). (c) Total amount of lipids in tumor-infiltrated dendritic cells from tumor-bearing Atg5f/f (red) or ITGAX/CD11c-atg5−/- mice (blue). (d) Data shown in dot graph (3 ~ 4 mice per group; *P < 0.05). Data are representative of 3 similar independent experiments.
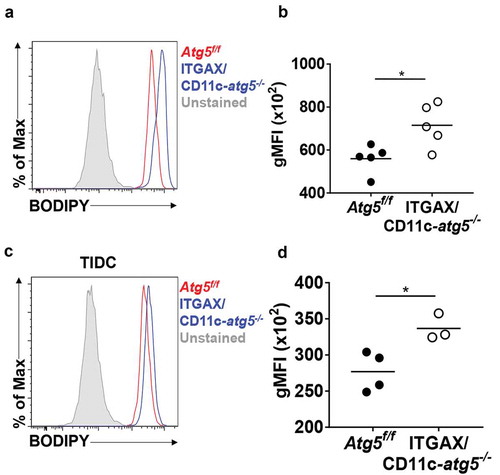
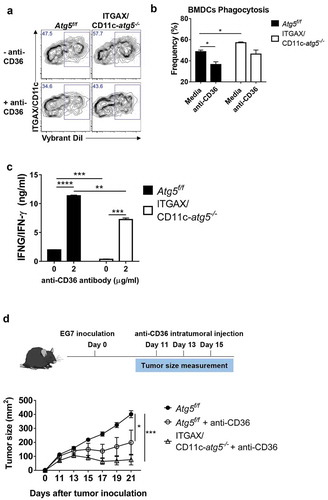
Figure 8. Blockade of CD36 ameliorates elevated phagocytosis and increases CD4+ T-cell priming. (a) BMDCs from Atg5f/f or ITGAX/CD11c-atg5−/- mice were co-cultured with DiI-labeled apoptotic tumor cells in the presence of anti-mouse CD36 blocking antibody. Phagocytosis of dendritic cells was measured with flow cytometry. (b) Frequency of phagocytosis shown as bar graph (Student t-test, * P < 0.05). Data represent 3 independent experiments. (c) Atg5f/f or ITGAX/CD11c-atg5−/- splenic dendritic cells were co-cultured with apoptotic EG7 and OT-II CD4+ T cells with or without anti-mouse CD36 blocking antibody for 96 h. IFNG/IFN-γ production in the supernatant were measured with ELISA (Student t-test; **P < 0.01; ***P < 0.001; ****P < 0.0001). Data represents 2 independent experiments. (d) EG7 tumor-bearing Atg5f/f or ITGAX/CD11c-atg5−/- mice were injected intratumorally with anti-mouse CD36 blocking antibody at day 11, 13, and 15 after EG7 inoculation. Tumor size was monitored with a digital caliper (5 mice per group; two-way ANOVA; *P < 0.05; ***P < 0.001). Data are representative of 2 independent experiments.