Figures & data
Figure 1. ULK1 protects cells against PA-induced cell death. (a) Ulk1 WT or ulk1 KO MEF cells were incubated with PA (500 μM) for the indicated times. Cell viability was estimated using a Cell titer-Glo assay kit. Live cell numbers were expressed as absorbance at luminescence. (b) Immunoblot analysis with antibodies against cleaved PARP, cleaved CASP3, and ACTB (loading control) in cells treated as described in (a). (c) Ulk1 WT or ulk1 KO MEF cells treated with PA was detected by FACS analysis for CASP3 activity. (d) TUNEL analysis of cells treated as in (a). Scale bar: 200 μm. (e) Ulk1 WT or ulk1 KO MEF cells were treated as described in (a) and ROS levels were determined using CM-H2DCFH-DA. Representative images are shown. Scale bar: 200 μm. (f) Quantification of TUNEL analysis. (g) Quantitative analysis of cells treated as in (a). Relative dichlorofluorescein fluorescence was calculated by averaging fluorescence levels from 80 to 100 cells, after subtracting background fluorescence, from images obtained using a fluorescence microscope. Data are presented as mean ± SD from three independent experiments. *p < 0.05 and **p < 0.01.
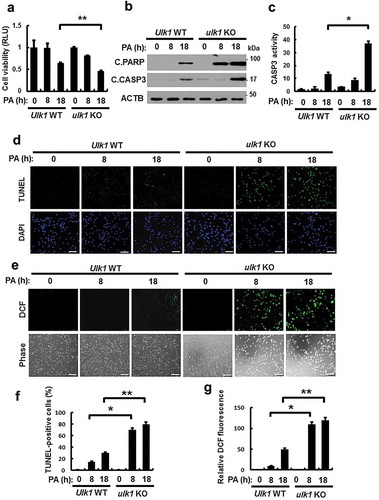
Figure 2. ULK1 is required for KEAP1 degradation and NFE2L2 activation in PA-treated cells. (a) Ulk1 WT or ulk1 KO MEF cells expressing MYC-NFE2L2 were treated with BSA or PA (500 μM) for 18 h and subjected to immunofluorescence analysis using an antibody specific for MYC. Nuclei were also stained with DAPI. Scale bars: 10 μm. (b) Nuclear fractions of Ulk1 WT or ulk1 KO MEF cells were treated with PA (500 μM) for indicated times and subjected to immunoblot analysis with antibodies specific for NFE2L2 and LMNB1. Total mRNA isolated from cells were treated as described in (b) and subjected to qRT-PCR analysis for Gsta1, Hmox1 (c), Nqo1, Srxn1 (d), Keap1 (f) and Ulk1 (g) mRNA. (e) Immunoblot analysis of KEAP1, p-ULK1(S317), ULK1, and ACTB (loading control) in Ulk1 WT or ulk1 KO MEF cells after treatment with PA (500 μM) for the indicated times. Densitometric analysis of KEAP1 (f) and ULK1 (g) immunoblots. Data are mean ± SD from three independent experiments. *p < 0.05 and **p < 0.01. N.S, not significant.
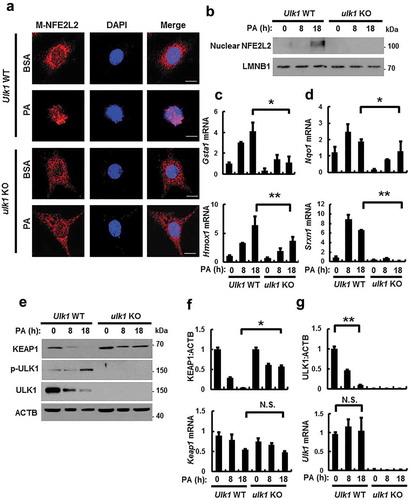
Figure 3. PA-mediated ULK1 phosphorylation is partially mediated by AMPK and required for KEAP1 degradation in PA-treated cells. (a) Immunoblot analysis of p-AMPK, AMPK, p-ULK1(S317), ULK1, and ACTB (loading control) in Prkaa WT or prkaa KO MEF cells after treatment with PA (500 μM) for the indicated times. Densitometric analysis of p-AMPK:AMPK (b) and p-ULK1:ULK1 (c) immunoblots were also performed. (d) Immunoblot analysis of p-AMPK, AMPK, p-ULK1(S317), ULK1, and ACTB (loading control) in Hepa1c1c7 cells after treatment with PA (500 μM) and compound C (C.C; 10 μM) for 18 h. Densitometric analysis of p-AMPK:AMPK (e) and p-ULK1:ULK1 (f) immunoblots were also performed. (g) HEK293 cells co-transfected with vectors encoding HA-ULK1 and either HA-ULK1S317A and MYC-SQSTM1, FLAG-KEAP1 and were subjected to immunoblot analysis using antibodies specific for the indicated proteins. Densitometric analysis of KEAP1 (h) and SQSTM1 (i) immunoblots were also performed. Data are presented as the mean ± SD from three independent experiments. *p < 0.05 and **p < 0.01.
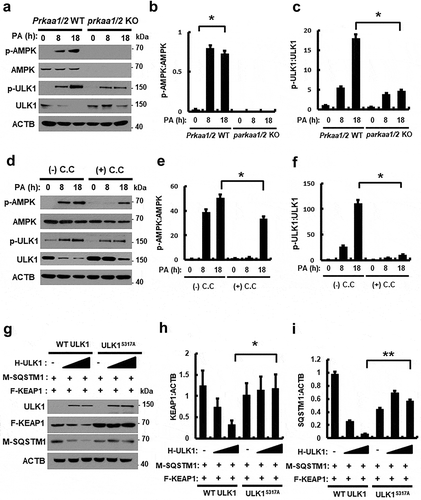
Figure 4. PA-induced ULK1 degradation is mediated by SQSTM1-dependent autophagy. (a) Immunoblot analysis of ULK1, SQSTM1, LC3B, and ACTB (loading control) in Atg5 WT or atg5 KO MEF cells after treatment with PA (500 μM) for the indicated times. (b) Densitometric analysis of ULK1 immunoblots was also performed. Total mRNA isolated from cells was treated as described in (a) and subjected to qRT-PCR analysis for Ulk1 mRNA. (c) Immunoblot analysis of ULK1, SQSTM1, and ACTB (loading control) in Sqstm1 WT or sqstm1 KO MEF cells after treatment with PA (500 μM) for the indicated times. (d) Densitometric analysis of ULK1 immunoblots was also performed. Total mRNA isolated from cells was treated as described in (c) and subjected to qRT-PCR analysis for Ulk1 mRNA. Data are provided as the mean ± SD from three independent experiments. **p < 0.01. N.S, not significant.
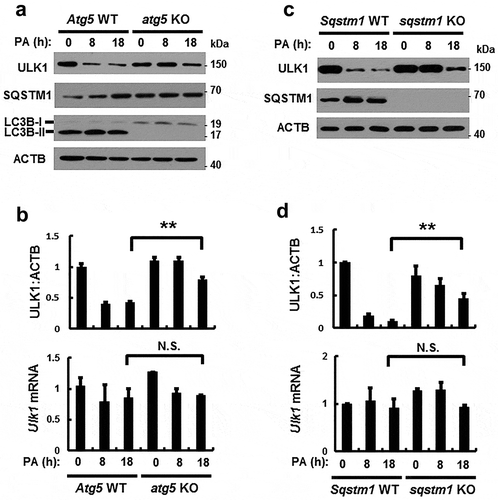
Figure 5. ULK1 interacts with SQSTM1 and KEAP1. Lysates from HEK293 cells transfected with vectors encoding FLAG-ULK1 (a) or HA-ULK1 (b) together with those expressing MYC-SQSTM1 (a) or FLAG-KEAP1 (b) were subjected to immunoprecipitation with antibodies against FLAG or HA, and the resulting precipitates (IPs) as well as whole cell lysates (WCLs) were subjected to immunoblot analysis using antibodies specific for the indicated proteins. Confocal microscopy analysis of co-localization of F-ULK1 and either H- KEAP1 (c) or H-SQSTM1 (d) Nuclei were stained with DAPI, and representative single optical sections and merge images are shown. Scale bars: 10 μm. Lysates from HEK293 cells transfected with deletion constructs of M-SQSTM1 (e) or KEAP1 (f) were subjected to immunoprecipitation with antibodies specific for FLAG, and the resulting IPs and WCLs were subjected to immunoblot analysis using antibodies specific for the indicated proteins. (g) Lysates from HEK293 cells transfected with F-ULK1, H-KEAP1, and M-SQSTM1 were subjected to immunoprecipitation with antibodies to HA, and the resulting IPs and WCLs were subjected to immunoblot analysis using antibodies specific for the indicated proteins. (h) Lysates from Ulk1 WT or ulk1 KO MEF cells were subjected to immunoprecipitation with antibodies to SQSTM1, and the resulting IPs and WCLs were subjected to immunoblot analysis using antibodies specific for the indicated proteins.
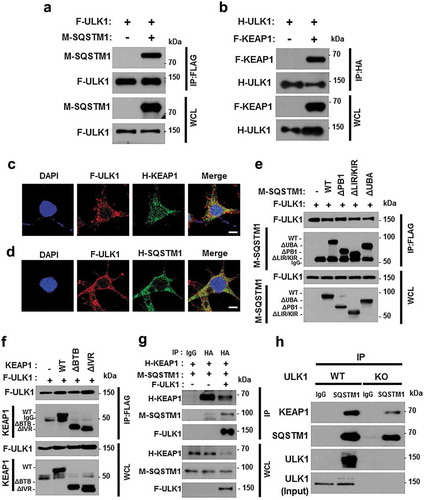
Figure 6. Overexpression of ULK1 alleviates PA-induced cell death in ulk1 KO cells. ulk1 KO MEF cells were transfected with vectors encoding FLAG-ULK1 and treated with PA (500 μM) for 18 h. (a) Cell viability was estimated using a Cell titer-Glo assay kit. Live cell numbers were expressed as absorbance at luminescence. (b) Immunoblot analysis of ULK1, cleaved CASP3, cleaved PARP, KEAP1, LC3B, and ACTB (loading control) in ulk1 KO MEF cells transfected with vectors encoding F-ULK1 and treated with PA (500 μM) for 18 h. (c) TUNEL analysis of cells treated as in (a). (d) ROS levels were determined using CM-H2DCFH-DA. Representative images are shown. Scale bar: 200 μm. (e) Quantification of TUNEL analysis and DCF fluorescence. Total mRNA was isolated from cells treated as described in (a) and subjected to qRT-PCR analysis for Gsta1, Srxn1 (f) and Hmox1, Nqo1 (g) mRNA expression. Data are shown as mean ± SD from 3 independent experiments. *p < 0.05 and **p < 0.01.
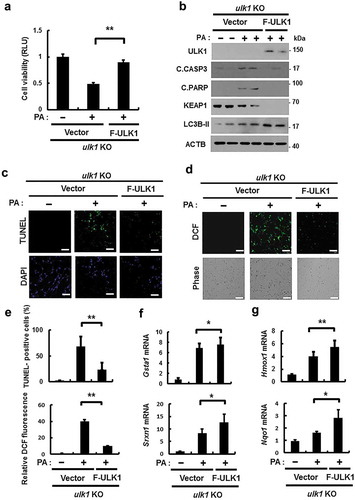
Figure 7. ULK1 protects cells form PA-induced mitochondrial damage. (a) Mitochondrial detection by electron microscopy (EM) in Ulk1 WT or ulk1 KO MEF cells after treatment with PA (500 μM). Scale bar: 2 μm. (b) Quantitative analysis of damaged mitochondria. (c) TMRE fluorescence analysis of Ulk1 WT or ulk1KO MEF cells after treatment with PA (500 μM) for the indicated times, and (d) Quantitative analysis of damaged mitochondria based on TMRE fluorescence. (e) MitoSOX Red fluorescence analysis of confocal microscopy analysis of Ulk1 WT or ulk1 KO MEF cells after treatment with PA (500 μM) or MitoTempo. (f) Quantitative analysis of MitoSOX Red fluorescence. Scale bar: 20 μm. Data are mean ± SD from three independent experiments. *p < 0.05 and **p < 0.01.
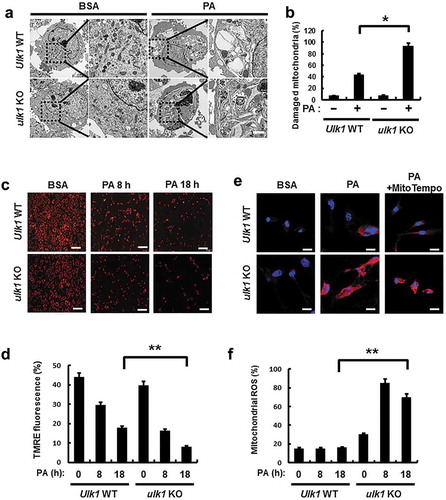
Figure 8. ULK1 is required for PA-induced mitophagy. (a) Immunoblot analysis of MFN1, TOMM20, and ACTB (loading control) in Hepa1c1c7 cells after treatment with PA (500 μM) for the indicated times. (b) Confocal microscopy analysis of colocalization of TOMM20, and LC3B. (c) Immunoblot analysis of MFN1, TOMM20, and ACTB (loading control) in Ulk1 WT or ulk1 KO MEF cells after treatment with PA (500 μM) for the indicated times. (d) Confocal microscopic analysis of colocalization of TOMM20, and LC3B in Ulk1 WT or ulk1 KO MEF cells after treatment with PA (500 μM) for 18 h. Nuclei were also stained with DAPI, and representative single optical sections and merge images are shown. Scale bars: 5 μm. (e) HEK293 cells co-transfected with vectors encoding HA-WT ULK1 or the HA-ULK1S317A mutant were subjected to immunoblot analysis using antibodies specific for the indicated proteins. (f) Confocal microscopy analysis of colocalization of TOMM20 and LC3B proteins in HEK293 cells co-transfected with vectors encoding H-ULK1 or the H-ULK1S317A mutant, after treatment with PA (500 μM) for 18 h. Nuclei were also stained with DAPI, and representative single optical sections and merge images are shown. Scale bars: 10 μm. (g,h) Quantitative analysis of colocalization of TOMM20 and LC3B. Data are presented as mean ± SD from three independent experiments.
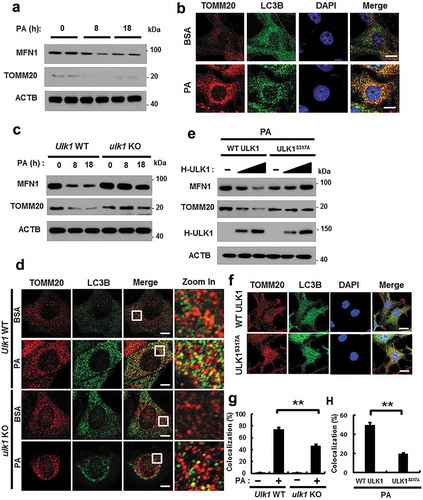
Figure 9. PINK1 interacts with SQSTM1 and LC3B. (a) Mitochondrial fractionation analysis was performed using Hepa1c1c7 cells after treatment with PA (500 μM) for the indicated times, and samples were subjected to immunoblot analysis using antibodies specific for PINK1, MFN1, and TUBA (loading control). (b) Confocal microscopy analysis of MitoRED and PINK1 staining in Hepa1c1c7 cells after treatment with PA (500 μM) for 18 h. Nuclei were also stained with DAPI, and representative single optical sections and merge images are shown. Scale bars: 10 μm. (c) Lysates of HEK293 cells transfected with vectors encoding FLAG-PINK1 and MYC-LC3B were subjected to immunoprecipitation with MYC antibodies, and the resulting precipitates (IPs), as well as whole cell lysates (WCLs), were subjected to immunoblot analysis with antibodies specific for the indicated proteins. (d) Confocal microscopy analysis of colocalization of TOMM20 and LC3B in Sqstm1 WT or sqstm1 KO MEF cells after treatment with PA (500 μM) for 18 h. (e) Quantitative analysis of colocalization of TOMM20 and LC3B. Scale bars: 5 μm. (f) Immunoblot analysis of MFN1, TOMM20, SQSTM1, and ACTB (loading control) in Sqstm1 WT or sqstm1 KO MEF cells after treatment with PA (500 μM) for the indicated times. Densitometric analysis of MFN1 (g) and TOMM20 (h) immunoblots were also performed. (i) Lysates of HEK293 cells transfected with deletion constructs of M-SQSTM1 and F-PINK1 were subjected to immunoprecipitation with FLAG antibodies, and the resulting IPs and WCLs were subjected to immunoblot analysis using antibodies specific for the indicated proteins. Data are shown as mean ± SD from 3 independent experiments. *p < 0.05 and **p < 0.01.
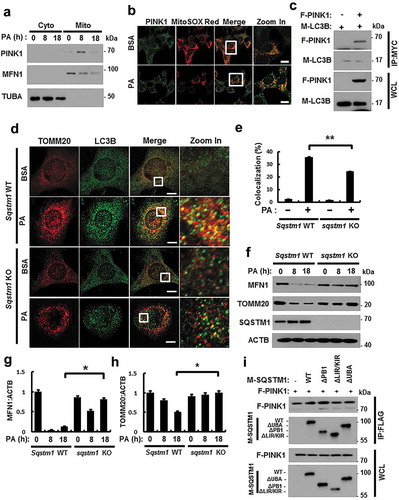
Figure 10. ULK1 enhances the interaction between SQSTM1 and PINK1. (a) Mitochondrial fractionation analysis of Hepa1c1c7 cells after treatment with PA (500 μM) for the indicated times; samples were subjected to immunoblot analysis using antibodies specific for ULK1, MFN1, and TUBA (loading control). (b) Confocal microscopy analysis of MitoSOX Red and ULK1 staining in Hepa1c1c7 cells after treatment with PA (500 μM) for 18 h. Nuclei were also stained with DAPI, and representative single optical sections and merge images are shown. Scale bars: 10 μm. (c) Lysates of HEK293 cells transfected with MYC-PINK1 and FLAG-ULK1 were subjected to immunoprecipitation using MYC antibodies, and the resulting immunoprecipitation (IPs), as well as the whole cell lysates (WCLs), were subjected to immunoblot analysis with antibodies specific for the indicated proteins. (d) Lysates of HEK293 cells transfected with F-ULK1 and M-LC3B was subjected to IPs with MYC antibodies, and the resulting IPs and WCLs were subjected to immunoblot analysis using antibodies specific for the indicated proteins. (e) Lysates from HEK293 cells transfected with F-PINK, M-SQSTM1, and H-ULK1 were subjected to immunoprecipitation using MYC antibodies, and the resulting IPs and WCLs were subjected to immunoblot analysis with antibodies specific for the indicated proteins. (f) Lysates from Ulk1 WT or ulk1 KO MEF cells were subjected to immunoprecipitation with antibodies for SQSTM1, and the resulting IPs and WCLs were subjected to immunoblot analysis using antibodies specific for the indicated proteins. (g) Confocal microscopy analysis of SQSTM1 and ULK1 colocalization. Scale bar: 5 μm. (h) Confocal microscopy analysis of colocalization of LC3B and ULK1 in Hepa1c1c7 cells co-transfected with vectors encoding M-LC3B and H-ULK1. Scale bar: 5 μm. Data are presented as the mean ± SD from three independent experiments.
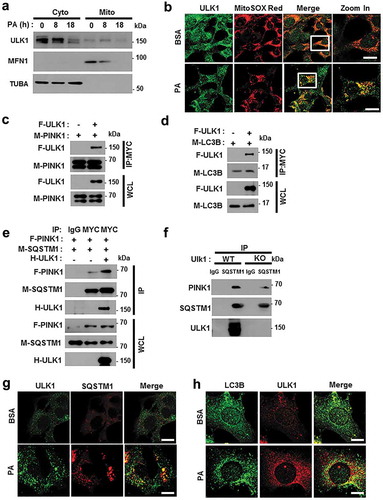
Figure 11. Overexpression of ULK1 increases PA-induced mitophagy and alleviates mitochondrial damage. (a) Immunoblot analysis of MFN1, TOMM20, ULK1, and ACTB (loading control) in ulk1 KO MEF cells transfected with vectors encoding FLAG-ULK1 and treated with PA (500 μM) for 18 h. Densitometric analysis of MFN1 (b) and TOMM20 (c) immunoblots was performed. (d) Confocal microscopy analysis of TOMM20 and LC3B colocalization in ulk1 KO MEF cells transfected with vectors encoding F-ULK1 after treatment with PA (500 μM) for 18 h. Nuclei were also stained with DAPI, and representative single optical sections and merge images are shown. Scale bars: 10 μm. (e) TMRE fluorescence analysis of ulk1 KO MEF cells transfected with vectors encoding F-ULK1 after treatment with PA (500 μM). Scale bars: 20 μm. (f) Fluorescence analysis of mitochondrial ROS in ulk1 KO MEF cells transfected with vectors encoding F-ULK1 after treatment with PA (500 μM), using MitoTracker Green (MitoGreen) and MitoSOX Red staining. Scale bar: 10 μm. (g) Mitochondrial detection using electron microscopy (EM) in ulk1 KO MEF cells transfected with vectors encoding F-ULK1 and treated with PA (500 μM) for 18 h. Scale bar: 2 μm. Data are shown as mean ± SD from three independent experiments. *p < 0.05.
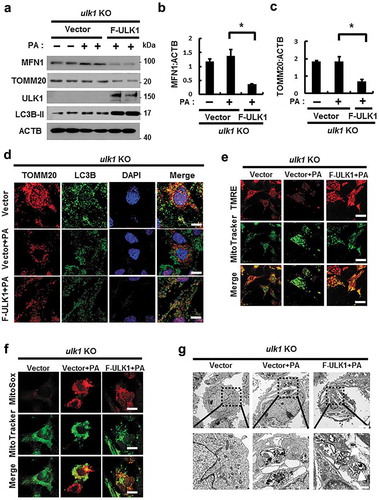
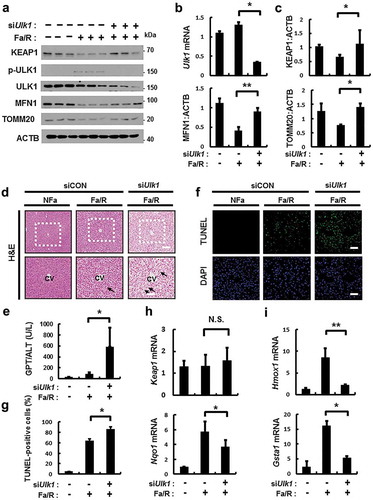
Figure 12. ULK1 is required for hepatoprotection against lipotoxicity via activation of the SQSTM1-NFE2L2-KEAP1 pathway and mitophagy. B6 mice were maintained in a non-fasted state (NFa) or fasted overnight and then refed a high-carbohydrate, fat-free diet (Fa/R). (a) Immunoblot analysis of liver tissues with antibodies against KEAP1, p-ULK1, ULK1, MFN1, TOMM20 and ACTB (loading control). (b) qRT-PCR analysis of Ulk1 mRNA and densitometric analysis of MFN1 immunoblot were performed. (c) Densitometric analysis of KEAP1 and TOMM20 immunoblots were performed. (d) Liver sections of mice were stained using H&E. CV, central vein. Scale bar: 200 μm. (e) Serum alanine aminotransferase (ALT) levels were measured in mice. (f) Images from TUNEL analysis of liver sections from mice. Scale bar: 200 μm. (g) Quantitative analysis of TUNEL-positive cells. qRT-PCR analysis of Keap1, Nqo1, (h) Hmox1, and Gsta1 (i) mRNA. Data are means ± standard errors for eight or nine mice per group. *p < 0.05 and **p < 0.01. N.S, not significant. Data are presented relative to the corresponding values for non-fasted mice and are means ± standard errors for 8 or 9 mice per group.