Figures & data
Figure 1. Regorafenib inhibits the growth of GBM cells in vitro and in vivo and has no obvious systemic toxicity in mice. (a) The MTT assay of U87, U251, U118, H4, BV2, C6 cells and primary GBM cells treated with indicated concentrations of regorafenib for 24 h. Primary GBM cells were obtained from brain tumor tissues from GBM patients. (b) Analysis of LDH (lactate dehydrogenase) release in supernatants of U87 and U251 cells treated with indicated concentrations of regorafenib for 24 h. (c) Analysis of EdU incorporation in GBM cells treated with the indicated concentrations of regorafenib for 24 h. (d) Quantification of clone numbers of U87 cells and U251 cells treated with the indicated concentration of regorafenib for 48 h. Cell proliferation rate was determined by colony formation assay. (e) Representative images of isolated U87 tumor xenografts of mice in cohorts treated with vehicle or regorafenib (20 mg/kg/day). Treatment was initiated 24 h after tumors reached 150 mm3. Scale bar: 2 cm. (f) The weight of individual tumors in (e). (g) Tumor volume was determined at the indicated time points. (h) MKI67 expression of tumors in (e) was detected by IHC. Scale bar: 25 μm. (i) Relative intensity of MKI67 staining in (h). (j) Representative MRI image of tumors in the GBM orthotopic mouse model. Mice were treated with vehicle or regorafenib (20 mg/kg/day) for 15 days. (k) Kaplan-Meier curves of GBM orthotopic mice from (j). (l) U87 cells expressing mCherry were implanted into the brain of 3dpf flk:eGFP Casper zebrafish followed by treatment with or without 5 μM regorafenib for 3 days. The zebrafish were then monitored by stereo microscope. (m) Body weights of mice in (e) measured at the indicated time points. Scale bar: 250 μm. (n) H&E staining of the heart, liver, lung, spleen, and kidney in mice treated with vehicle or regorafenib (20 mg/kg/day). Scale bar: 100 μm. Data are means ± s.d. and are representative of 3 independent experiments. *P < 0.05, **P < 0.01; ***P < 0.001.
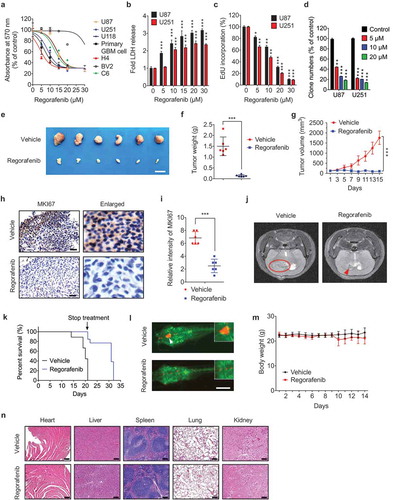
Figure 2. Regorafenib induces autophagy initiation and blocks autophagosome-lysosome fusion in GBM cells. (a) Immunoblotting analysis of LC3B expression in GBM cells treated with indicated concentrations of regorafenib for 24 h. (b) Autophagic vesicles detected by transmission electron microscope in U87 cells treated with or without 20 μM regorafenib for 24 h. Scale bar: 2 μm. N, nucleus. Arrows, autophagic vesicles. (c) The amount of autophagic vesicles in (b). (d) Co-immunoprecipitation analysis of the interaction between BECN 1 and BCL2 in GBM cells treated with or without 20 μM regorafenib for 24 h. (e) Immunoblotting analysis of LC3B expression in GBM cells treated with or without 20 μM regorafenib in the presence or absence of 5 mM 3-MA for 24 h. (f) Immunoblotting analysis of LC3B expression in GBM cells transfected with siScramble or siATG5 for 24 h, followed by treatment with or without 20 μM regorafenib for another 24 h. (g) Immunofluorescence analysis of the colocalization of endogenous LC3B and LAMP1 in U251 cells treated with or without 20 μM regorafenib for 24 h. Cells were incubated with serum- and glucose-free medium (starvation) for 2 h as positive control. Scale bar: 10 μm. (h) The amount of co-localized puncta of LC3B and LAMP1 in (g). (i) Immunofluorescence analysis of cells transiently transfected with tandem mRFP-GFP-tagged LC3B and treated with or without 20 μM regorafenib for 24 h. Scale bar: 10 μm. (j) Quantification of the ratio of red puncta indicating AL (autolysosome) versus yellow puncta indicating AP (autophagosome) in (i). (k) Representative images of GBM cells incubated with BODIPY-conjugated bovine serum (DQ-BSA, red) for 1 h and followed by 20 μM regorafenib treatment for 24 h, or incubation with serum- and glucose-free medium (starvation). Scale bar: 20 μm. (l) Immunoblotting analysis of ubiquitinated proteins in GBM cells treated with or without 20 μM regorafenib for 24 h. (m) U87 cells transfected with tandem mRFP-GFP-tagged LC3B for 24 h were subjected to live-cell microscopy. Small panels show the life time of the GFP-LC3B signal indicated by an arrow in the whole cell image. Times represents minutes post glucose- and serum-starvation or 20 μM regorafenib treatment for 2 h. Scale bar: 5 μm. Data are means ± s.d. and are representative of 3 independent experiments. *P < 0.05, **P < 0.01; ***P < 0.001.
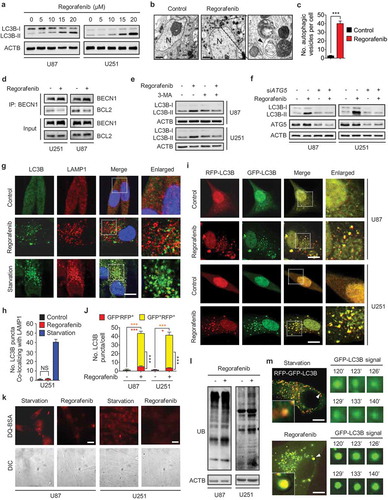
Figure 3. Regorafenib inhibits GBM cell growth by promoting autophagosome accumulation. (a) The MTT assay of GBM cells treated with indicated concentrations of regorafenib in the presence or absence of 5 μM CQ (chloroquine) for 24 h. (b) EdU assay of GBM cells treated with or without 5 mM 3-MA, or 5 μM CQ in the presence or absence of 20 μM regorafenib for 24 h. (c) Quantification of clone numbers of GBM cells treated with or without 5 μM CQ, in the presence or absence of 20 μM regorafenib for 24 h. (d) Quantification of clone numbers of GBM cells treated with or without 5 mM 3-MA, in the presence or absence of 20 μM regorafenib for 72 h. (e) LDH release in the supernatant of U87 cells treated with or without 20 μM regorafenib in the presence or absence of siATG5, 5 μM CQ, 100 nM Baf-A1, 5 mM 3-MA, or 200 nM wortmannin for 24 h. (f) EdU assay of GBM cells transfected with siScramble, or siATG5 for 24 h, followed by treatment with or without 20 μM regorafenib for another 24 h. (g) The MTT assay of GBM cells transfected with siScramble or siATG7 for 24 h, followed by treatment with or without 20 μM regorafenib for another 24 h. Data are means ± s.d. and are representative of 3 independent experiments. *P < 0.05, **P < 0.01; ***P < 0.001.
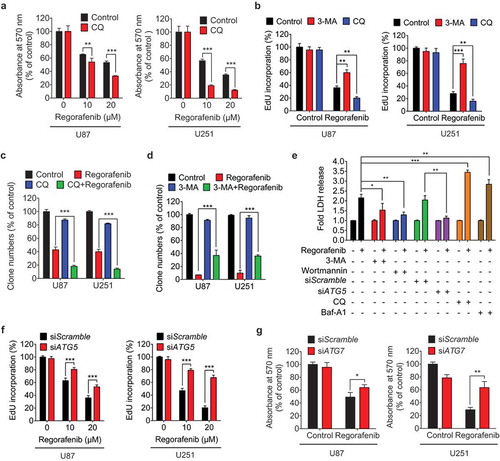
Figure 4. Regorafenib induces autophagosome accumulation by stabilizing PSAT1. (a) Changes in protein abundance in U87 cells treated with DMSO or 20 μM regorafenib were analyzed by TMT label-based quantitative mass spectrometry. Each dot represents a distinct protein from 2 replicated experiments. (b) Immunoblotting analysis of PSAT1 expression in GBM cells treated with or without 20 μM regorafenib for 24 h. (c) Immunoblotting analysis of PSAT1 in tumor xenografts obtained from vehicle- or regorafenib (20 mg/kg/day)-treated mice. (d) Superposition of the regorafenib binding domains of human PSAT1 (gray, PDB accession 3E77). Residues are labelled in red. (e) Cellular thermal shift assay showing PSAT1 target engagement by regorafenib in U251 cells. (f) Isothermal titration calorimetry analysis of regorafenib binding with recombinant human PSAT1. (g) HEK 293 cells were transfected with Flag-PSAT1 for 24 h and then treated with regorafenib and MG132 for another 6 h. The ubiquitination of PSAT1 was detected by immunoblotting after co-immunoprecipitation. (h) GBM cells were transfected with siScramble or siPSAT1 for 24 h, followed by treatment with or without 20 μM regorafenib for another 24 h. The protein levels of LC3B and PSAT1 were analyzed by immunoblotting. (i) GBM cells were treated as in (h). The LC3B puncta were analyzed by immunofluorescence. Scale bar: 20 μm. (j) The number of LC3B puncta in (i). (k) GBM cells were transfected with empty vector or HA-PSAT1 plasmid for 48 h, or treated with 20 μM regorafenib for 24 h. The protein levels of LC3B and PSAT1 were analyzed by immunoblotting. (l) GBM cells were transfected with vector or HA-PSAT1 plasmid for 48 h. The formation of endogenous LC3B puncta was analyzed by immunofluorescence. Scale bar: 20 μm. (m) The number of LC3B puncta in (l). Data are means ± s.d. and are representative of 3 independent experiments. *P < 0.05, **P < 0.01; ***P < 0.001.
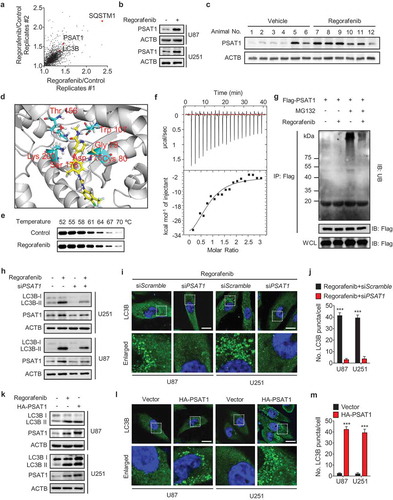
Figure 5. PSAT1 is involved in PRKAA activation and RAB11A downregulation in regorafenib-treated GBM cells. (a) Immunoblotting analysis of PRKAA and ACACA levels, as well as the phosphorylation levels of PRKAA (Thr172) and ACACA (Ser 79) in cells treated with or without regorafenib at different time points and doses as indicated. (b) Cells were transfected with siScramble or siPRKAA for 24 h, followed by treatment with or without 20 μM regorafenib for another 24 h. Protein levels of LC3B, p-PRKAA (Thr172), PRKAA, p-ACACA (Ser 79) and ACACA was detected by immunoblotting analysis. (c) Cells were transfected with empty vector or DN-PRKAA for 24 h, followed by treatment with or without 20 μM regorafenib for another 24 h. Protein levels of LC3B, p-PRKAA (Thr172), PRKAA, p-ACACA (Ser 79) and ACACA was detected by immunoblotting analysis. (d) Immunoblotting analysis of PSAT1, PRKAA, and ACACA levels, as well as the phosphorylation levels of PRKAA (Thr172) and ACACA (Ser 79) in cells transfected with empty vector or HA-PSAT1 plasmid for 48 h. (e) Immunofluorescence analysis of the endogenous LC3B puncta in U87 cells co-transfected with HA-PSAT1 and DN-PRKAA plasmids for 48 h. Scale bar: 10 μm. (f) Cells were transfected with empty vector or RAB11A plasmid for 24 h, followed by treatment with or without 20 μM regorafenib for another 24 h. Protein levels of LC3B, SQSTM1 and RAB11A were detected by immunoblotting analysis. (g) U87 cells expressing tandem mRFP-GFP-tagged LC3B were treated as in (f). LC3B puncta was examined by immunofluorescence analysis. Scale bar: 10 μm. (h) qPCR analysis of the mRNA levels of PSAT1 and RAB11A in cells transfected with empty vector or HA-PSAT1 plasmid. (i) qPCR analysis of the mRNA levels of PSAT1 and RAB11A in cells transfected with shScramble or shPSAT1 plasmid. (j) Immunoblotting analysis of LC3B, RAB11A, PSAT1 and SQSTM1 expression in GBM cells transfected with HA-PSAT1 plasmid, in combination with empty vector or RAB11A plasmid for 48 h. (k) Immunofluorescence analysis of the colocalization of endogenous LC3B and LAMP1 in GBM cells transfected with HA-PSAT1 plasmid in combination with empty vector or RAB11A plasmid. Scale bar: 10 μm. Data are means ± s.d. and are representative of 3 independent experiments. *P < 0.05, **P < 0.01; ***P < 0.001.
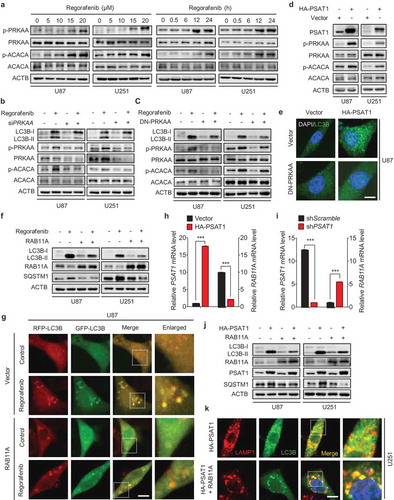
Figure 6. PSAT1 is required for regorafenib-induced GBM suppression and is downregulated in human GBM. (a) U87 cells stably expressing shScramble or shPSAT1 were treated with indicated concentrations of regorafenib for 24 h. LDH release in the supernatants of U87 cells was measured. (b) U87 cells stably expressing shScramble or shPSAT1 were treated with indicated concentrations of regorafenib for 48 h. Survival fraction values of U87 cells were then quantified. (c) U87 cells stably expressing shScramble or shPSAT1 were subcutaneously inoculated into nude mice. Photograph of isolated tumors derived from mice treated with vehicle or regorafenib (20 mg/kg/day) for 7 days. (d) Tumor weights of mice in (c) at time of sacrifice. (e) Immunohistochemistry staining of PSAT1 in normal brain and different grades of glioblastoma. Scale bar: 50 μm. (f) The relative mRNA levels of PSAT1 in different grades glioma patients from the TCGA-GBM dataset. (g) Immunohistochemistry analysis of PSAT1, LC3B and SQSTM1 levels in GBM tissues. Scale bar: 25 μm. (h-j) Correlation of PSAT1, LC3B and SQSTM1 immunostaining intensity in the tissue array. (k) Kaplan–Meier analysis of percent survival based on PSAT1 expression in TCGA-GBM dataset. Z-score = (intensity G – mean intensityG1 … Gn)/SDG1 … Gn, G stands for any gene and G1… Gn stands for the aggregate measure of all values of staining intensity. Data are means ± s.d. and are representative of 3 independent experiments. *P < 0.05, **P < 0.01; ***P < 0.001.
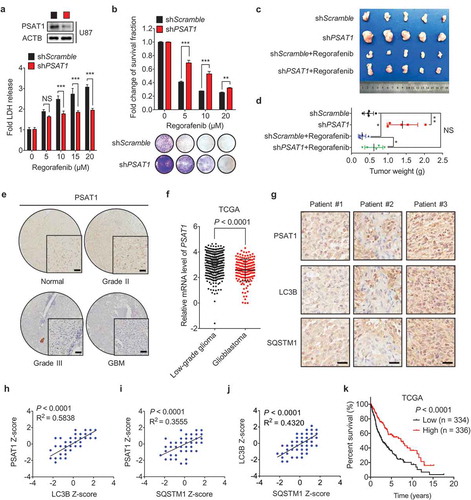
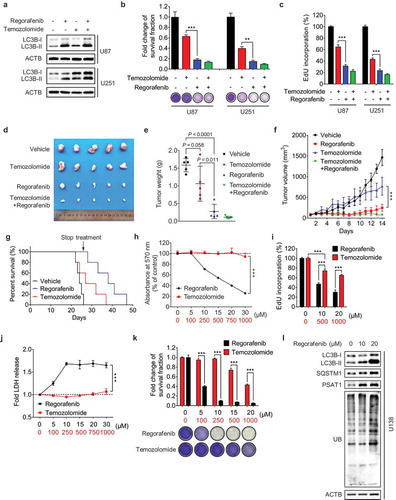
Figure 7. Regorafenib exhibits superior anti-GBM efficacy to temozolomide in vitro and in vivo. (a) Immunoblotting analysis of LC3B in GBM cells treated with or without 20 μM regorafenib, in combination with or without 500 μM temozolomide for 24 h. (b) GBM cells were treated with 20 μM regorafenib or 500 μM temozolomide for 48 h, followed by crystal violet staining and quantification of survival fraction. (c) EdU incorporation assay of GBM cells treated as in (a). (d-f) Nude mice were subcutaneously inoculated with U87 cells and treated with regorafenib (20 mg/kg/day) alone or in combination with or without temozolomide (10 mg/kg/day) for 14 days. Photograph of isolated tumor xenografts (d). Tumor weights at time of sacrifice (e). Tumor volumes measured at indicated time points (f). (g) Kaplan-Meier analysis of percent survival in mice treated with control, temozolomide (10 mg/kg/day), or regorafenib (20 mg/kg/day). (h-k) The MTT assay (h), EdU incorporation (i), LDH release in supernatants (j) and fold change of survival fraction (k) of U138 cells treated with indicated concentrations of regorafenib or temozolomide for 24 h. (l) Immunoblotting analysis of LC3B, SQSTM1, PSAT1, and ubiquitinated proteins in U138 cells treated with indicated concentrations of regorafenib for 24 h. Data are means ± s.d. and are representative of 3 independent experiments. *P < 0.05, **P < 0.01; ***P < 0.001.