Figures & data
Figure 1. The structure of UBA5 LIR in complex with GABARAP proteins reveals a new mechanism of interaction. (a) NMR solution structure of the complex between GABARAPL2 (representative conformer is shown as a gray cartoon) and UBA5 LIR peptide (all 20 conformers are shown; residues 340–348 that interact with GABARAPL2 in red; N-terminal unstructured residues 333–339 in gray). UBA5 side chains I343, L345 and V346 (red sticks) are allocated to the 2 hydrophobic pockets HP1 and HP2 of GABARAPL2 (beige and turquoise, respectively). The side chain of the conserved UBA5 W341 is placed in the cleft between α-helix α1 and loop L3 of GABARAPL2 (HP0, blue). (b) Crystal structure of GABARAP (gray cartoon) in complex with UBA5 LIR peptide (red). Similar, to the complex with GABARAPL2, side chains of UBA5 I343, L345 and V346 are placed in the canonical hydrophobic pockets (HP1, beige, and HP2, turquoise). W341 of UBA5 binds in proximity to α-helix α1 of GABARAP (HP0, blue). (c) Comparison of the Atg8-family protein binding mechanisms for a canonical LIR and UBA5 LIR. In cases of canonical LIRs (left plot, LC3B:SQSTM1/p62 LIR complex as an example; gray and red, respectively), side chains of residues Θ (W340, red sticks) and Γ (L343, red sticks) of the core LIR sequence (Θ-X-X-Γ) are binding to the 2 hydrophobic pockets (HP1, beige; and HP2, turquoise) on the surface of Atg8 proteins. In the GABARAP:UBA5 LIR complex (right plot), HP1 is shallow and covered by I343 (red sticks) and L345 (red sticks) hydrophobic side chains. The UBA5 W341 side chain fits into the new hydrophobic pocket HP0 (blue). LC3B and GABARAP residues contributing to each hydrophobic pocket are indicated. (d) Mutational analysis of hydrophobic residues in UBA5 LIR (W341, I343, L345 and V346). Relative affinities of interaction between GABARAPL2 and mutated UBA5 LIR were determined by normalization to the binding of WT UBA5 LIR. All values are mean ± SD of 3 independent experiments. For each residue, the binding pocket on Atg8-family proteins is indicated. (e) WebLogo plot generated on the sequences of all UBA5 LIR mutations that resulted in an enhancement in their binding to GABARAPL2 and LC3B. Charged amino acids are colored in red, polar residues in green. The amino acid composition of UBA5 and p62 LIRs at each position is shown. The binding pockets on Atg8-family proteins for each residue are highlighted.
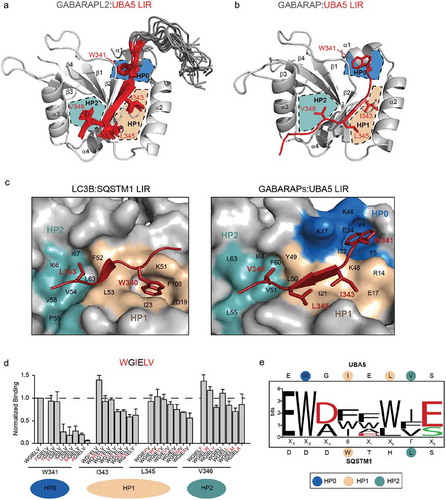
Figure 2. Rearrangements of the K46 and K/R47 side chains in GABARAP proteins upon interaction to UBA5 LIR mediate the new binding mechanism. (a) Section of the GABARAP:UBA5 LIR complex structure representing rearrangements of the GABARAP K46 and K47 side chains upon binding to the UBA5 LIR. The polypeptides are shown as cartoons (GABARAP gray, UBA5 LIR – red). Upon UBA5 LIR binding, K46 of GABARAP (gray sticks) undergoes a 180° rotation compared to the unbound conformation (orange sticks) to allow the entrance of the UBA5 W341 side chain (red sticks) into HP0. Simultaneously, K47 also undergoes a −180° rotation in comparison to the unbound state to avoid steric clashes. Thus, GABARAP K46 and K47 exchange their positions upon UBA5 LIR binding. Similar rearrangements are observed for the GABARAPL2 residues K46 and R47 (right blot). (b) The rearrangement of GABARAP K47 allows the formation of an additional intermolecular interaction to the UBA5 E344 side chain. In case of the GABARAPL2:UBA5 complex, the side chain of R47 of GABARAPL2 (gray sticks) can also interact with E344 (red sticks), but additionally is able to coordinate with the side chain of E340 of UBA5. These interactions stabilize the complex structure in addition to the formation of intermolecular β-sheet and fixation of the UBA5 aromatic/hydrophobic residues into the HP0, HP1 and HP2 on surface of the GABARAP proteins. (c) ITC results for the binding of GABARAPL2 R47 mutants to UBA5 LIR. The GABARAPL2 R47K mutation reduces slightly both the affinity and enthalpy of its binding to UBA5 LIR, indicating a preference for an arginine in this position (GABARAPL2) over a lysine (GABARAP and GABARAPL1). The ITC data correlate with the geometry of the intermolecular hydrogen bond described above. Accordingly, the GABARAPL2 mutation R47A reduces the affinity and enthalpy of UBA5 LIR binding, showing thermodynamic parameters of interaction close to that for LC3 proteins [Citation24]. The top diagram in each ITC profile displays the raw measurements and the bottom diagram shows the integrated heat per titration step. Best fit is presented as a solid line. Corresponding KD values are shown.
![Figure 2. Rearrangements of the K46 and K/R47 side chains in GABARAP proteins upon interaction to UBA5 LIR mediate the new binding mechanism. (a) Section of the GABARAP:UBA5 LIR complex structure representing rearrangements of the GABARAP K46 and K47 side chains upon binding to the UBA5 LIR. The polypeptides are shown as cartoons (GABARAP gray, UBA5 LIR – red). Upon UBA5 LIR binding, K46 of GABARAP (gray sticks) undergoes a 180° rotation compared to the unbound conformation (orange sticks) to allow the entrance of the UBA5 W341 side chain (red sticks) into HP0. Simultaneously, K47 also undergoes a −180° rotation in comparison to the unbound state to avoid steric clashes. Thus, GABARAP K46 and K47 exchange their positions upon UBA5 LIR binding. Similar rearrangements are observed for the GABARAPL2 residues K46 and R47 (right blot). (b) The rearrangement of GABARAP K47 allows the formation of an additional intermolecular interaction to the UBA5 E344 side chain. In case of the GABARAPL2:UBA5 complex, the side chain of R47 of GABARAPL2 (gray sticks) can also interact with E344 (red sticks), but additionally is able to coordinate with the side chain of E340 of UBA5. These interactions stabilize the complex structure in addition to the formation of intermolecular β-sheet and fixation of the UBA5 aromatic/hydrophobic residues into the HP0, HP1 and HP2 on surface of the GABARAP proteins. (c) ITC results for the binding of GABARAPL2 R47 mutants to UBA5 LIR. The GABARAPL2 R47K mutation reduces slightly both the affinity and enthalpy of its binding to UBA5 LIR, indicating a preference for an arginine in this position (GABARAPL2) over a lysine (GABARAP and GABARAPL1). The ITC data correlate with the geometry of the intermolecular hydrogen bond described above. Accordingly, the GABARAPL2 mutation R47A reduces the affinity and enthalpy of UBA5 LIR binding, showing thermodynamic parameters of interaction close to that for LC3 proteins [Citation24]. The top diagram in each ITC profile displays the raw measurements and the bottom diagram shows the integrated heat per titration step. Best fit is presented as a solid line. Corresponding KD values are shown.](/cms/asset/353d53aa-d7ec-46ac-ab7d-492b687be599/kaup_a_1606637_f0002_oc.jpg)
Figure 3. Loop L3 and K/R47 in GABARAP proteins predetermine their specificity to UBA5 LIR over LC3 proteins (a and b). 3 regions in LC3 and GABARAP proteins show large differences in the sequences and the structures of their canonical LIR and UBA5 LIR bound forms. (a) Region I resides around α-helix α1; region II defines the loop L3, which has a different length and composition in between the LC3 and GABARAP subfamily. Region III is defined as the R/K47 residue in GABARAPs (T50 in LC3A/LC3B and T56 in LC3C) that forms an intermolecular hydrogen bond with UBA5 E344 and undergoes large rearrangements upon UBA5 LIR binding. (b) Cartoon representation of the backbone superposition of the structures of GABARAP (blue) in complex with UBA5 LIR (red) and free LC3B (green). The indicated regions I, II and III locate around the binding interface of the UBA5 W341 side chain (red stick) and might be responsible for the selectivity and the novel binding mechanism. (c) ITC profiles representing interactions between LC3B swapping mutants in regions II, III and a combination of both with the WT UBA5 LIR. The top diagram in each ITC profile displays the raw measurements and the bottom diagram shows the integrated heat per titration step. The best fit is presented as a solid line. Corresponding KD values for each mutant are shown. (d) ITC profiles representing interactions between GABARAPL2 swapping mutants in regions II, III and a combination of both with the WT UBA5 LIR. The top diagram in each ITC profile displays the raw measurements and the bottom diagram shows the integrated heat per titration step. The best fit is presented as a solid line. Corresponding KD values for each mutant are shown.
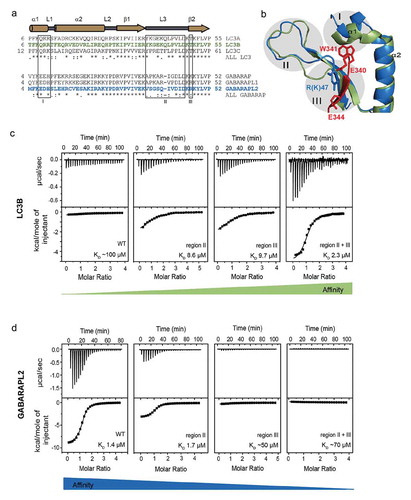
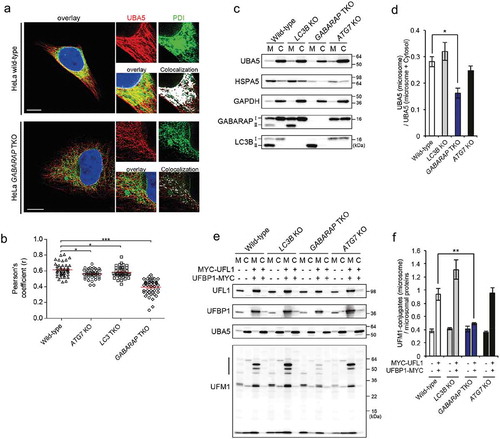
Figure 4. GABARAPs recruits UBA5 to ER membranes. (a) Localization of endogenous UBA5 in HeLa wild-type and HeLa GABARAP-TKO cells visualized by immunofluorescence. Cells were stained for endogenous UBA5 (red) and endogenous PDI (green) was used as ER marker. Co-localization was determined via the Co-localization Finder software plugin of the ImageJ software and is shown in white. Scale bar: 10 µm. (b) Quantification of co-localization of the endogenous UBA5 and the ER marker PDI in HeLa wild-type and HeLa ATG7-knockout, LC3s-knockout and GABARAPs-TKO. Pearson’s correlation coefficient was determined using the coloc2 software implemented in ImageJ. Results show the evaluation of 50 randomly chosen cells of 3 independent biological experiments. ***, P < 0.001. (c) The microsomal (M) and cytoplasmic (C) fractions of HEK293T cell lines were prepared from indicated genotype cells and subjected to SDS-PAGE, followed by immunoblotting with the indicated antibodies. Data are representative of 3 separate experiments. (d) Bar graphs indicate the quantitative densitometric analysis of microsomal UBA5 relative to microsomal and cytoplasmic UBA5 in HEK293T cell lines. Statistical analysis was performed using an unpaired t test (Welch test). Bars represent the mean ± SE of 3 separate experiments. *, P < 0.05. (e) Empty vector or MYC-UFL1 together with UFBP1-MYC were transfected into HEK293T cells as indicated. 24 h after transfection, the microsome (M) and cytoplasmic (C) fractions were prepared and subjected to SDS-PAGE, followed by immunoblotting with the indicated antibodies. (f) Bar graphs indicate the quantitative densitometric analysis of microsomal ufmylated proteins (shown by the line at the left side in figure 5E) relative to the loaded microsomal protein amount (estimated by Ponceau-S staining) in normal conditions (left bars) and upon induction of UFL1/UFBP1 activity (right bars). Statistical analysis was performed using an unpaired t test (Welch test). Bars represent the mean ± SE of 3 separate experiments. **, P < 0.01.