Figures & data
Figure 1. The DeepPhagy procedure for computationally identifying autophagic and non-autophagic yeast cells from fluorescent images. In the imaging pre-processing step, the original 1024 × 1024 confocal images were first downsampled to a lower resolution of 650 × 650 pixels for quicker processing. Individual cells were located and then cropped to a size of 61 × 61 pixels, centred on their weighted centroids. In the autophagy monitoring step, a 5-layer CNN model was constructed containing 3 consecutive convolutional blocks for feature representations and 2 fully connected layers for image classifications. The functions of ReLU, LRN and Max pooling were used to avoid gradient diffusion, improve the generalization capacity and reduce feature dimensionality, respectively.
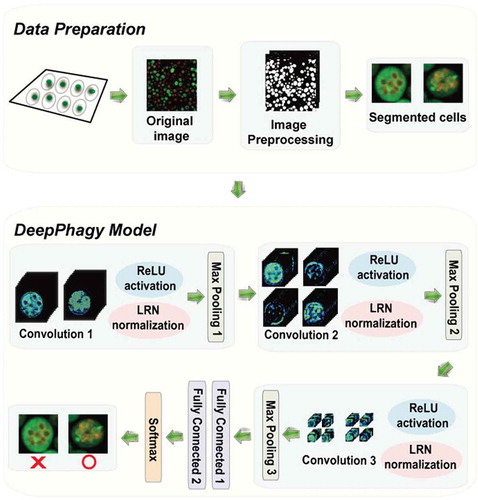
Figure 2. The computational performance of DeepPhagy 1.0. (A) The ROC curves and AUC values of 4-, 6-, 8- and 10-fold cross-validations of DeepPhagy and 10-fold cross-validations of CellProfiler, DeepYeast and DeepLoc on the same training dataset [Citation12,Citation28,Citation29]. (B) The comparison of DeepPhagy, CellProfiler, DeepYeast and DeepLoc on the testing dataset. (C) Six types of mistakes occurred in DeepPhagy, including the identification of regions with no cells, regions with low signals, dead and immature cells, false-negative hits and false-positive predictions. Scale bar: 2 µm. (D) t-SNE visualization of extracted features demonstrating the ability to distinguish autophagic cells from non-autophagic cells for DeepPhagy and other methods [Citation31].
![Figure 2. The computational performance of DeepPhagy 1.0. (A) The ROC curves and AUC values of 4-, 6-, 8- and 10-fold cross-validations of DeepPhagy and 10-fold cross-validations of CellProfiler, DeepYeast and DeepLoc on the same training dataset [Citation12,Citation28,Citation29]. (B) The comparison of DeepPhagy, CellProfiler, DeepYeast and DeepLoc on the testing dataset. (C) Six types of mistakes occurred in DeepPhagy, including the identification of regions with no cells, regions with low signals, dead and immature cells, false-negative hits and false-positive predictions. Scale bar: 2 µm. (D) t-SNE visualization of extracted features demonstrating the ability to distinguish autophagic cells from non-autophagic cells for DeepPhagy and other methods [Citation31].](/cms/asset/18d6cf93-feca-44cf-b741-320b1158028d/kaup_a_1632622_f0002_oc.jpg)
Figure 3. The importance of a global threshold for large-scale analyses. (A) An original image of atg17Δ at 5 h after nitrogen starvation. Scale bar: 5 µm. (B) From the image, 57 autophagic and 64 non-autophagic cells were manually labelled. (C) DeepPhagy labelled 112 autophagic and 15 non-autophagic cells under a lower threshold of 0.30. (D) Under a higher threshold of 0.60, 33 autophagic and 94 non-autophagic cells were computationally labelled. (E) The global threshold was calculated with a minimum SD of the manually and computationally labelled results. (F) Under the global threshold of 0.45, DeepPhagy labelled 62 autophagic and 65 non-autophagic cells.
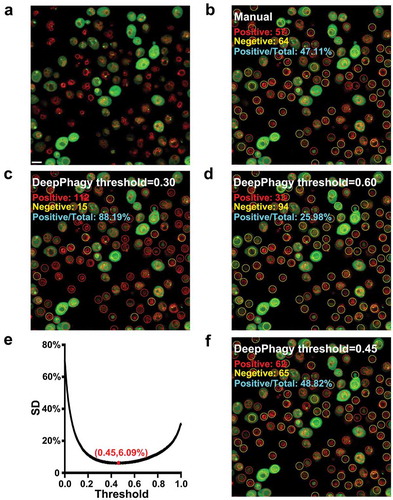
Figure 4. A systematic and time-course analysis of the autophagy process in atg KO mutants. Yeast cells were cultured in nitrogen starvation medium (SD [–N]) and imaged by fluorescence microscopy at 1 h intervals from 0 to 5 h. All images were analyzed by DeepPhagy and the autophagy activity was assessed by calculating the proportion of autophagic cells against all detected cells for each image. (A) The hierarchical clustering algorithm classified the autophagic phenotypes of 36 yeast strains into 3 categories, class I, class II and class III. (B) The PCA-based classification of autophagic phenotypes. (C) The autophagy activity values at different time points for each yeast strain.
![Figure 4. A systematic and time-course analysis of the autophagy process in atg KO mutants. Yeast cells were cultured in nitrogen starvation medium (SD [–N]) and imaged by fluorescence microscopy at 1 h intervals from 0 to 5 h. All images were analyzed by DeepPhagy and the autophagy activity was assessed by calculating the proportion of autophagic cells against all detected cells for each image. (A) The hierarchical clustering algorithm classified the autophagic phenotypes of 36 yeast strains into 3 categories, class I, class II and class III. (B) The PCA-based classification of autophagic phenotypes. (C) The autophagy activity values at different time points for each yeast strain.](/cms/asset/7488a976-119c-41e9-919b-3fbca8f3fa66/kaup_a_1632622_f0004_oc.jpg)
Figure 5. Biochemical validations of the DeepPhagy results. (A) Partial images computationally labelled by DeepPhagy are shown for atg1Δ and atg21Δ (class I), atg17Δ and atg23Δ (class II), and atg19Δ and atg26Δ (class III). It can be observed that most of cells were correctly labelled. Scale bar: 5 µm. (B) Immunoblotting assays for the 6 atg KO mutants at different time points during nitrogen starvation. The protein expression level of Pgk1 was used as a control and the free GFP:total GFP ratios were quantified to measure autophagy activity. (C) The comparison of autophagy activities quantified by DeepPhagy (white columns) and immunoblotting assays (black columns).
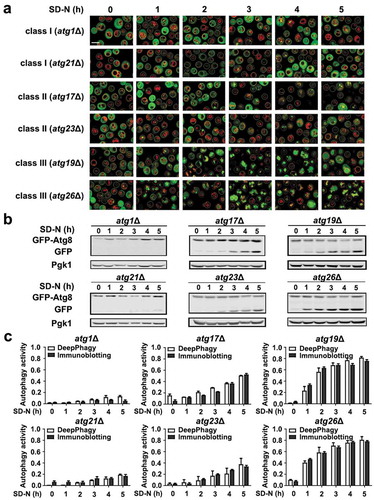
Figure 6. The PPI network of yeast Atg proteins was visualized by Circos [Citation33]. From mentha and BioGRID, we retrieved 63 unique pairs of experimentally identified PPIs among 31 Atg proteins [Citation34,Citation35]. For the arc of the outer ring, different colors denote the Atg protein categories and the lengths are proportional to the number of interacting partners for each Atg. The average autophagy activities of each atg KO mutant during nitrogen starvation are diagrammed in the inner ring. Different interaction types are marked with different colors. Atg proteins conserved or not in H. sapiens are shown in red or blue, respectively.
![Figure 6. The PPI network of yeast Atg proteins was visualized by Circos [Citation33]. From mentha and BioGRID, we retrieved 63 unique pairs of experimentally identified PPIs among 31 Atg proteins [Citation34,Citation35]. For the arc of the outer ring, different colors denote the Atg protein categories and the lengths are proportional to the number of interacting partners for each Atg. The average autophagy activities of each atg KO mutant during nitrogen starvation are diagrammed in the inner ring. Different interaction types are marked with different colors. Atg proteins conserved or not in H. sapiens are shown in red or blue, respectively.](/cms/asset/ad72d8de-a60d-4f0c-bcfc-53f3f791fe01/kaup_a_1632622_f0006_oc.jpg)
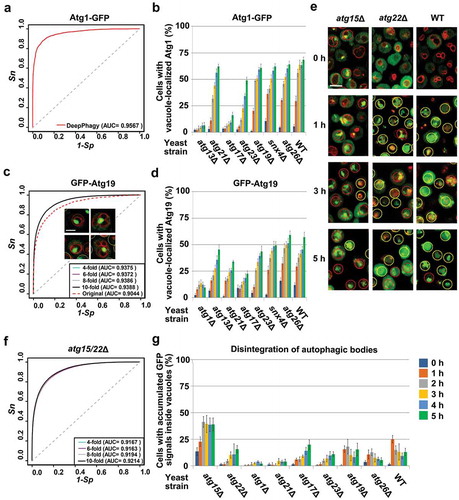
Figure 7. The applicability of DeepPhagy for analyzing other types of autophagic phenotypes. For large-scale analyses, a pre-defined global threshold of 0.45 was adopted (). (A) The accuracy of DeepPhagy for directly discriminating cells with or without Atg1-GFP vacuolar delivery. (B) The DeepPhagy-based analysis of Atg1-GFP targeting in the WT and 7 atg KO strains. (C) The accuracies of the original DeepPhagy model and the newly re-trained model for recognizing GFP-Atg19 vacuolar delivery. The original model mistakenly recognized a proportion of cells containing large GFP puncta associated with the vacuolar membrane as positive hits, while this type of error was alleviated in the new model. Scale bar: 2 µm. (D) The automatic analysis of GFP-Atg19 targeting in the WT and 7 atg KO strains. (E) Cells with accumulated or dispersed GFP signals inside their vacuoles were manually labelled as positive or negative cells, respectively. Scale bar: 5 µm. (F) The accuracy of the recognition of disintegrating autophagic bodies based on manually labelled atg15Δ and atg22Δ mutant cells. (G) The automatic analysis of the autophagic-body breakdown in the WT and 8 atg KO strains.