
Figures & data
Table 1. Clinical features of 30 newly diagnosed MM patients.
Table 2. Clinical and pathological characteristics of 30 newly diagnosed MM patients.
Figure 1. MIR145-3p downregulation is associated with disease prognosis in human MM. (A) MIR145-3p expression in five MM cell lines (U266, NCI-H929, RPMI-8226, LP-1 and KM3) and normal plasma cells (PCs). MIR145-3p expression levels were calculated by the MIR145-3p:RNU6 expression ratio (i.e., 2−ΔCt). (B) Comparison of MIR145-3p expression in SDC1/CD138+ plasma cells from 30 newly diagnosis MM patients and 18 normal healthy donors via qRT-PCR. (C-F) Expression patterns of MIR145-3p with albumin (C), B2M (beta-2-microglobulin) (B), creatinine (E), and calcium (F) (all *P < 0.05; **P < 0.01). (G) Survival analysis of MM patients with low MIR145-3p expression using Kaplan-Meier curves. Low expression level of MIR145-3p was associated with shorter progression-free survival (PFS) (P < 0.05). The mean value was used as the cut-off point for definition of low and high MIR145-3p expression groups.
Figure 2. MIR145-3p inhibits cell proliferation and promotes apoptosis in MM cells. (A) Relative expression of MIR145-3p detected by qRT-PCR in LP-1 cells 48 h after transfection with MIR145-3p mimic or MIR control (MIRctrl). (B) LP-1 cells were transfected with MIRctrl or MIR145-3p mimic for 24–96 h. Cell growth was measured by CCK-8 assay. (C) After transfection with MIRctrl or MIR145-3p for 72 h, MM cell apoptosis was determined by ANXA5 and 7-AAD staining. (D) After transfection with MIR ctrl or MIR145-3p for 72 h, LP-1 cells were lysed and extracted. Western blotting was performed to detect the expression levels of the active cleaved CASP3. TUBB was used as the loading control. All the data were presented as mean ± SD from 3 independent experiments (*P < 0.05; **P < 0.01) .
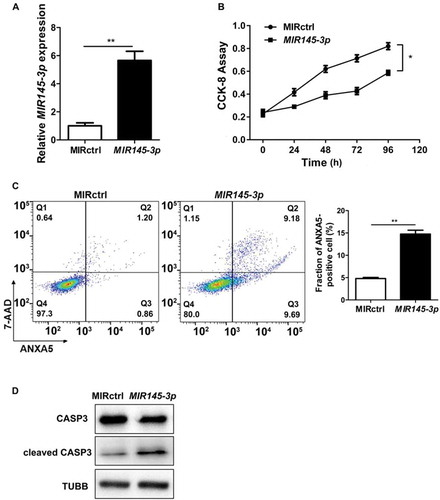
Figure 3. MIR145-3p induces autophagic flux in MM cells. (A) LP-1 cells expressing GFP-MAP1LC3B were transfected with MIR control (MIRctrl) or MIR145-3p and were treated with or without lysosomal inhibitor bafilomycin A1 (BAF) (20 nM) for 4 h. Then cells were visualized with a fluorescence microscope. Representative images are shown. (B) Quantitative analysis of the experiments in (A) (mean ± SD of independent experiments, n = 3, **P < 0.01.). (C) LP-1 cells were transfected with MIRctrl or MIR145-3p mimic, and then incubated with normal or starvation (STV) medium Earle’s balanced salt solution (EBSS) as indicated for 2 h, in the absence or presence of 20 nM BAF. Whole-cell extracts were subjected to immunoblotting with anti-MAP1LC3B and SQSTM1 antibodies. GAPDH was used as loading control. The experiments were performed in triplicate. (D) KM3 cells expressing GFP-MAP1LC3B were transfected with MIRctrl or MIR145-3p inhibitor and were treated with or without BAF (20 nM) for 4 h. Then cells were visualized with a fluorescence microscope. Representative images are shown. (E) Quantitative analysis of the experiments in (D) (mean ± SD of independent experiments, n = 3, **P < 0.01.). (F) KM3 cells were transfected with MIRctrl or MIR145-3p inhibitor, and then incubated with normal or STV as indicated for 2 h, in the absence or presence of 20 nM BAF. Whole-cell extracts were subjected to immunoblotting with anti-MAP1LC3B and SQSTM1 antibodies. GAPDH was used as loading control. The experiments were performed in triplicate. (G and H) LP-1 cells were transfected with MIRctrl or MIR145-3p, and then treated with the autophagy inhibitors 3-MA (50 mmol/L) or CQ (50 nmol/L). Cells were lysed and extracted. Western blotting was performed to detect the expression levels of MAP1LC3B and SQSTM1. GAPDH was used as loading control. The experiments were performed in triplicate. (I and J) Western blot showing the effect of silencing ATG5 and ATG7, whole-cell extracts were subjected to immunoblotting with anti-ATG5 and ATG7 antibodies. ACTB (actin beta) was used as loading control. The experiments were performed in triplicate. (K and L) LP-1 cells were transfected with MIRctrl or MIR145-3p first, and then transfected with siRNA-ATG5 or siRNA-ATG7. Cells were lysed and extracted. Western blotting was performed to detect the expression levels of ATG5, ATG7, MAP1LC3B and SQSTM1, respectively. GAPDH was used as loading control. The experiments were performed in triplicate. (M) LP-1 cells were transfected with MIRctrl or MIR145-3p first, and then treated with 3-MA (50 mmol/L) and CQ (50 nmol/L) or transfected with siRNA-ATG5 and siRNA-ATG7. Cells were analyzed by flow cytometry after ANXA5-7-AAD staining. The percentage of ANXA5-positive cells was presented as mean ± SD from 3 independent experiments (*P < 0.05; **P < 0.01) .
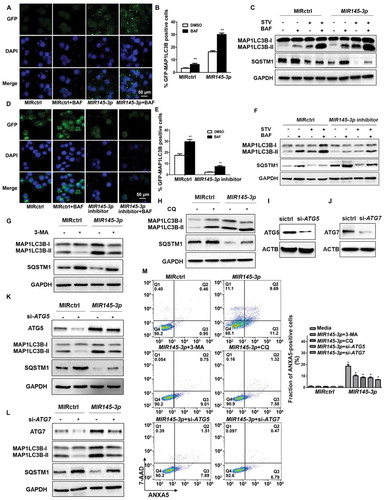
Figure 4. MIR145-3p directly targets HDAC4 in MM cells. (A) Schematic representation of the binding between MIR145-3p and HDAC4 with mutant sites labeled with red shading. (B) Relative luciferase activities were analyzed in 293T cells co-transfected with HDAC4 3ʹ-UTR (wild type or mutant) reporter plasmid, and MIR145-3p mimic or MIR control (MIRctrl). Data were calculated by Student t test. (C) Expression patterns of HDAC4 with MIR145-3p in MM primary samples. (D) qRT-PCR analysis of HDAC4 mRNA expression in LP-1 cells transfected with MIR145-3p mimic or MIRctrl. The relative expression of MIR145-3p was calculated by the MIR145-3p:RNU6 ration. All data were presented as mean ± SD (*P < 0.05; **P < 0.01). (E) Western blot analysis of HDAC4 protein expression in LP-1 cells transfected with MIR145-3p mimic at increasing concentrations or MIRctrl. GAPDH was used as loading control. The experiments were in performed in triplicate.
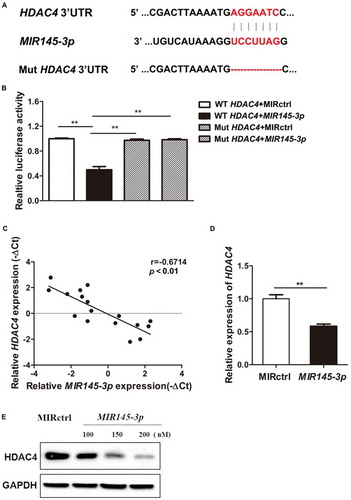
Figure 5. MIR145-3p induces autophagy and cell death through the inhibition of HDAC4 in MM cell. (A) LP-1 cells were transfected with MIR145-3p mimic, MIR control (MIRctrl), siRNA-HDAC4 or control siRNA (sictrl) for 72 h, and then cell apoptosis was analyzed by ANXA5 and 7-AAD staining. The percentage of ANXA5-positive cells was presented as mean ± SD from 3 independent experiments (*P < 0.05; **P < 0.01, NS, not significant). (B) After transfection with MIR145-3p mimic, MIRctrl, siRNA-HDAC4 or sictrl for 72 h, LP-1 cells were lysed and extracted. Western blotting was performed to detect the expression levels of the active cleaved CASP3 and BCL2L11. GAPDH was used as loading control. The experiments were performed in triplicate. (C) LP-1 cells expressing GFP-MAP1LC3B were transfected with siRNA-HDAC4 or sictrl and were treated with or without lysosomal inhibitor BAF (20 nM) for 4 h. Then cells were visualized with a fluorescence microscope. Representative images are shown. (D) Quantitative analysis of the experiments in (C) (mean ± SD of independent experiments, n = 3, **P < 0.01.). (E) LP-1 cells were transfected with MIR145-3p mimic, MIRctrl, siRNA-HDAC4 or sictrl for 72 h, in the absence or presence of 20 nM BAF, and then the protein levels of HDAC4, MAP1LC3B-I, MAP1LC3B-II, SQSTM1, RPS6KB1 and p-RPS6KB1 (Thr389) were determined by western blot analysis. GAPDH was used as loading control. The experiments were performed in triplicate. (F) LP-1 cells expressing GFP-MAP1LC3B were co-transfected with pcDNA-control (pcDNActrl) or pcDNA-HDAC4 vector and MIR145-3p mimic or MIRctrl and were treated with or without BAF (20 nM) for 4 h. Then cells were visualized with a fluorescence microscope. Representative images are shown. (G) Quantitative analysis of the experiments in (F) (mean ± SD of independent experiments, n = 3, **P < 0.01.). (H) LP-1 cells were co-transfected with either pcDNA-control (pcDNActrl) or pcDNA-HDAC4 vector and MIR145-3p mimic or MIRctrl for 72 h, in the absence or presence of 20 nM BAF, and then the protein levels of HDAC4, MAP1LC3B-I, MAP1LC3B-II, SQSTM1, RPS6KB1 and p-RPS6KB1 (Thr389) were determined by western blot analysis. GAPDH was used as loading control. The experiments were performed triplicate. (I) LP-1 cells were co-transfected with pcDNActrl or pcDNA-HDAC4 vector and MIR145-3p mimic or MIRctrl for 72 h, and then cell apoptosis was analyzed by ANXA5-7-AAD staining. The percentage of ANXA5-positive cells was presented as mean ± SD from 3 independent experiments (*P < 0.05; **P < 0.01) .
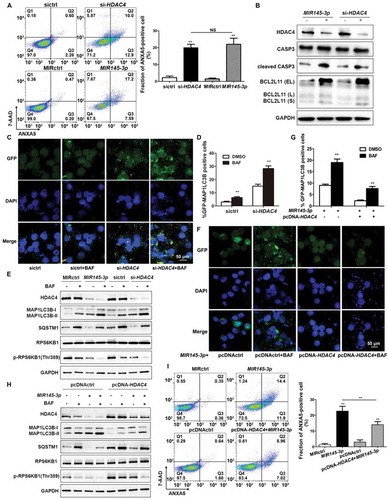
Figure 6. MIR145-3p mimic enhances the anti-MM activity of bortezomib through autophagy activation. (A) LP-1 cells were transfected with MIR145-3p or MIR control (MIRctrl) for 72 h, and then treated with 20 nM bortezomib (Bort) or vehicle for 24 h. Cell death was measured by ANXA5-7-AAD staining. The percentage of ANXA5-positive cells was presented as mean ± SD from 3 independent experiments. (B) LP-1 cells were transfected with siRNA-HDAC4 or negative siRNA control (sictrl) for 72 h, and then treated with 20 nM Bort or vehicle for 24 h. Cell death was measured by ANXA5-7-AAD staining. The percentage of ANXA5-positive cells was presented as mean ± SD from 3 independent experiments (all *P < 0.05; **P < 0.01). (C) LP-1 cells were transfected with MIR145-3p mimic, MIRctrl, siRNA-HDAC4 or sictrl for 72 h, and then treated with 20 nM Bort or vehicle for 24 h. MAP1LC3B and SQSTM1 protein levels were determined by western blotting. GAPDH was used as loading control. The experiments were performed in triplicate. (D) LP-1 cells were transfected with MIR145-3p mimic or MIRctrl for 72 h, in the presence or absence of 20 nM Bort, followed with or without BAF (20 nM) treatment for 4 h. MAP1LC3B and SQSTM1 protein levels were determined by western blotting. GAPDH was used as loading control. The experiments were performed in triplicate.
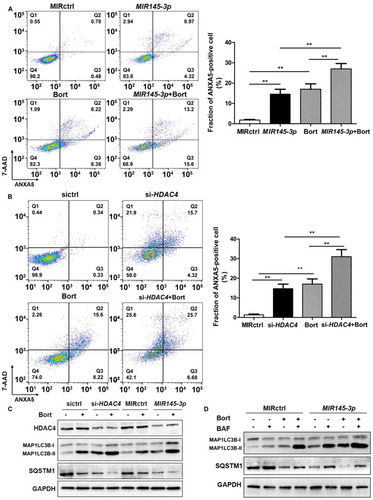
Figure 7. In vivo delivery of formulated agoMIR145-3ppotentiates the inhibitory effect of bortezomib on MM progression. For in vivo study, palpable subcutaneous tumors xenografts were randomized in 4 groups of treatment. Intratumoral treatment with agoMIR145-3p or agoMIR control (agoMIRctrl) was administered every three days, for a total of seven injections. Intraperitoneal treatment with bortezomib (Bort) was administered twice weekly, for a total of six injections. Combination treatment of agoMIR145-3p and Bort was given with the above described schedules. (A) Tumors were measured with an electronic caliper once a week (five mice for each group). Averaged tumor volume of each group mean ± SD shown (**P < 0.01). (B) The excised tumor from all the mice in each group. The mice were euthanized 35 days after inoculation. Tumors were removed and photographed. (C) Measurement of tumor weight was also made 35 days after inoculation. Data were presented as the mean ± SD from five mice of each group (*P < 0.05; **P < 0.01). (D) Immunohistochemical analysis of cleaved CASP3 and MAP1LC3B on tumor tissue sections from agoMIRctrl-, agoMIR145-3p-, Bort-, or combination-treated mice. Photographs were representative of 3 mice receiving each treatment. The magnifications are 40 × .
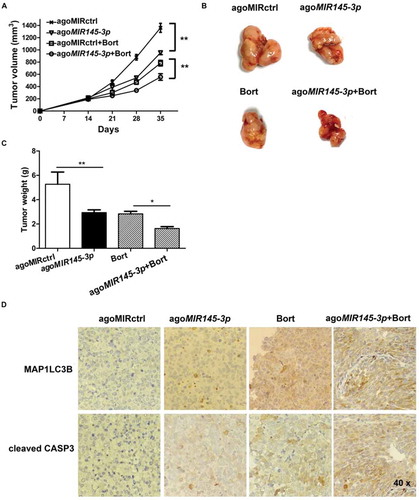
Table 3. PCR primers used in this work.