
Figures & data
Figure 1. Autophagy declines in the kidneys of mice with calcium oxalate (CaOx)-induced nephrocalcinosis. (A) Numbers of GFP-positive puncta per tubular cross-section (at least 30–50 tubules were counted) in RTCs of GFP-MAP1LC3 transgenic mice (LC3-mice) with glyoxylate (GOX) injection (n = 5/group). Arrows indicate MAP1LC3 puncta. (B) Amount of crystals formed, determined by polarized-light scope images and Pizzolato staining of kidneys extracted from LC3-mice injected with GOX (n = 5/group). (C) Immunostaining and western blotting (SQSTM1/p62; SQSTM1 and phosphorylated SQSTM1; p-SQSTM1) of kidneys from LC3-mice with GOX treatment; relative protein density is indicated (n = 5/group). (D) Pizzolato staining and fluorescence immunostaining of SQSTM1 (red) and counterstaining with DAPI (blue) in MAP1LC3-mice. Arrows and arrowheads indicate MAP1LC3 puncta and SQSTM1 puncta, respectively. (E) Transmission electron microscopy (TEM) images. Asterisks indicate the nucleus, and arrows indicate autolysosomes. M, mitochondria; L, lysosome; C, crystal. Scale bars: 1 mm (B), 20 μm (C, D), 10 μm (A, E; upper), and 0.5 μm (E; lower). Values at 0 h were adjusted to ‘1’ as a reference (C). *P < 0.05 versus 0 h, 6 h, and 12 h; #P < 0.05 versus 24 h; and †P < 0.05 versus 2 d (A, B). *P < 0.05 versus 0 h (C).
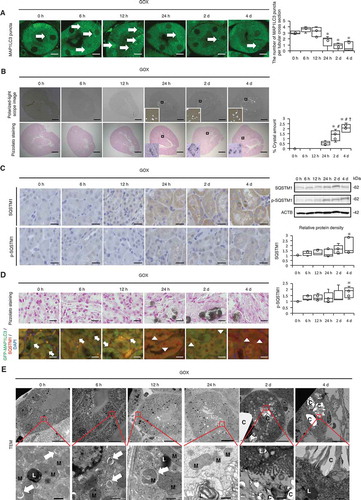
Figure 2. Autophagy is impaired upon exposure of renal tubular cells (RTCs) to CaOx monohydrate (COM) crystals. (A) Number of yellow (GFP + RFP) and red (RFP) puncta per cell and ratio of yellow:red puncta in RTCs with COM exposure transfected with tandem fluorescent-tagged LC3 (tfLC3). At least 30–50 cells were counted (n = 3). For starvation treatment, we cultured cells with Earle’s balanced salt solution (EBSS) for 2 h without COM. (B) Relative protein density and difference of MAP1LC3-II (bafilomycin+) and MAP1LC3-II (bafilomycin−), determined by western blotting (MAP1LC3) of RTCs with COM exposure and bafilomycin A1 (n = 5). (C) Adhesion ratio in polarized-light scope images of RTCs after COM exposure. Images were obtained from 10 random fields. At this resolution there were 200–300 cells per field (n = 3). (D) Relative protein density, determined by western blotting (SQSTM1 and p-SQSTM1) of RTCs with COM exposure (n = 5). (E) TEM images (at 4 h and 8 h after COM exposure). Asterisks indicate the nucleus, and arrows indicate phagophore and autolysosomes. C, crystal. Scale bars: 50 μm (C), 20 μm (A), 5 μm (E; I and IV), 2 μm (E; II and V), 1 μm (E; III and VI). Values at 0 h and bafilomycin− 0 h were adjusted to ‘1’ as a reference (A, B, D). *P < 0.05 versus 0 h, #P < 0.05 versus 2 h, †P < 0.05 versus 4 h.
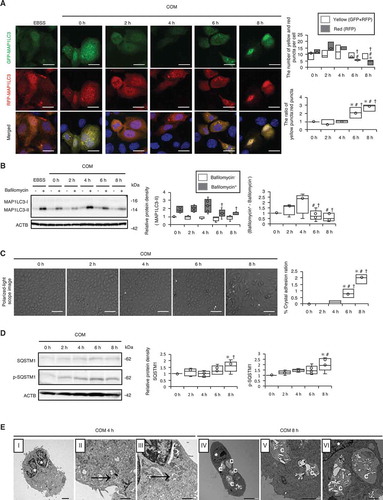
Figure 3. Impaired autophagic activity causes mitochondrial and lysosomal dysfunction. (A) MitoSOX fluorescence intensity showing mitochondrial ROS of RTCs treated with COM and counterstained with DAPI (blue); (B) Intensity of TOMM20 staining (red) in RTCs counterstained with DAPI (blue) after COM exposure. To uncouple mitochondrial oxidative phosphorylation, we treated cells with 10 μM carbonyl cyanide m-chlorophenyl hydrazine (CCCP) for 8 h. (C) Colocalization of FK2-TOMM20 puncta per cell in RTCs after COM exposure. (D) Relative protein density, determined by western blotting of non-cleaved and cleaved PINK1, PRKN/PARK2/PARKIN, and COX4I1 (n = 5). For starvation treatment, we cultured cells with Earle’s balanced salt solution (EBSS) for 2 h without COM treatment. (E) Colocalization of LysoTracker-LAMP1 puncta per cell in RTCs stained with LysoTracker Red, immunostained for LAMP1 (green), and counterstained with DAPI (blue) after treatment with COM (right). (F) Colocalization of LGALS3-LAMP1 puncta per cell in RTCs after COM exposure, immunostaining for LAMP1 (green) and LGALS3 (red), and counterstaining with DAPI (blue). To disrupt the lysosomal membrane, 500 mM LLOMe, a lysosomotropic compound, was used. (G) Colocalization of FK2-LGALS3 puncta per cell in RTCs after treatment with COM. (H) Quantification of gene expression (Tnf, Il6, and Sod1) in RTCs upon COM exposure (n = 5). Mean intensities of MitoSOX and TOMM20 per cell, measured using ImageJ. At least 30–50 cells were counted (n = 3). Colocalization of FK2-TOMM20 (FK2-positive-TOMM20), LysoTracker-LAMP1 (LysoTracker-positive-LAMP1), LGALS3-LAMP1 (LGALS3-positive-LAMP1), and FK-LGALS3 (FK2-positive-LGALS3) puncta per cell, measured using ImageJ (Manders coefficients were calculated). At least 30–50 cells were counted (n = 3). Scale bars: 20 μm (A–B, E–F). Each value at 0 h was adjusted to ‘1’ as a reference (D). *P < 0.05 versus 0 h, 2 h, and 4 h; #P < 0.05 versus 6 h; †P < 0.05 versus 0 h (A–G). *P < 0.05 versus 0 h and 2 h, #P < 0.05 versus 4 h (H).
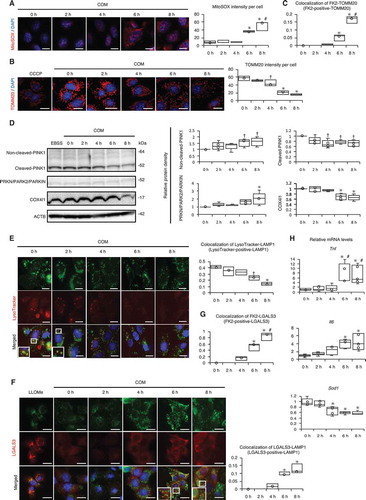
Figure 4. MTOR-TFEB axis was deregulated during kidney crystal formation. (A) Relative protein density, determined by western blotting of RPS6KB1/p70S6K, phosphorylated RPS6KB1/p70S6K (p-RPS6KB1/p70S6K), ULK1, phosphorylated ULK1 (p-ULK1), and nuclear and cytoplasmic TFEB in RTCs with COM exposure (n = 5). For starvation treatment, we cultured cells with EBSS for 2 h without COM. (B) Mean intensity of GFP-TFEB in nuclei of RTCs with COM exposure and/or Torin1. At least 30–50 cells were counted (n = 3). (C) Relative protein density, determined by western blotting (RPS6KB1/p70S6K, p-RPS6KB1/p70S6K, ULK1, p-ULK1, and nuclear and cytoplasmic TFEB) of kidneys extracted from LC3-mice with GOX injection (n = 5/group). (D) Quantification of gene expression (Lamp1 and Uvrag-DT) in RTCs with COM exposure and kidneys extracted from LC3-mice with GOX injection (n = 5). (E) Relative protein density, determined by western blotting of RPS6KB1/p70S6K and p-RPS6KB1/p70S6K in RTCs with COM exposure and/or NAC and of kidneys extracted from LC3-mice with GOX and/or NAC (n = 5). Each value at 0 h (A,C), COM 0 h and GOX 0 h (E) were adjusted to ‘1’ as a reference. *P < 0.05 versus 0 h, #P < 0.05 versus 2 h, and †P < 0.05 versus 4 h (A, B, D: in vitro); *P < 0.05 versus 0 h, #P < 0.05 versus 6 h, and †P < 0.05 versus 12 h (C, D: in vivo); *P < 0.05 versus COM and GOX 0 h and #P < 0.05 (E).
Figure 5. MTOR inhibition suppresses inflammation and crystal adhesion. (A) Ratio of yellow:red puncta, mean intensity of TOMM20 per cell, colocalization of LysoTracker-LAMP1 puncta per cell, and number of LGALS3 per cell in RTCs transfected with tfLC3; immunostained for TOMM20, LAMP1, and LysoTracker; counterstained with DAPI; and stained for LGALS3 after COM exposure and 3-MA or Torin1 treatment. The control group was treated with COM only. At least 30–50 cells were counted (n = 3). (B) Gene expression (Tnf, Il6, and Sod1) in RTCs with COM exposure and 3-MA or Torin1 treatment (n = 5). (C) Adhesion ratio to RTCs after COM exposure and 3-MA or Torin1 treatment. Images were obtained from 10 random fields. At this resolution, there were 200–300 cells per field (n = 3). Scale bars: 20 μm (A). Each value for yellow:red puncta at 0 h was adjusted to ‘1’ as a reference (A). *P < 0.05 versus 0 h with the same treatment, #P < 0.05 versus 2 h with the same treatment, †P < 0.05 versus 4 h with the same treatment, and ‡P < 0.05.
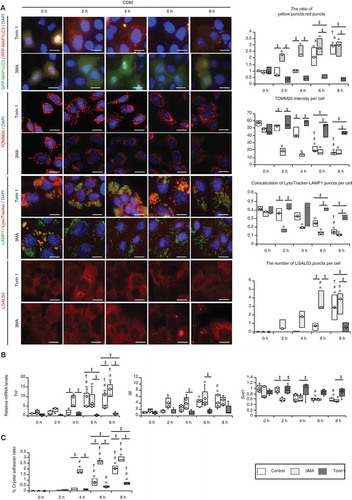
Figure 6. MTOR inhibition suppresses kidney crystal formation. (A) Numbers of GFP-MAP1LC3 puncta (arrows) per tubular cross-section in RTCs with or without rapamycin of LC3-mice treated with GOX. At least 30–50 tubules were counted (n = 5/group). The 0 h (GOX) group was injected with the same amount of PBS 1 day before sacrifice. The 0 h (GOX + rapamycin) group was injected with the same amount of PBS and the same amount of rapamycin 1 day before sacrifice. (B) Fluorescence immunostaining of SQSTM1 (red) and counterstaining with DAPI (blue) in MAP1LC3-mice. Arrows indicate MAP1LC3 puncta. (C) Relative protein density, determined by western blotting of SQSTM1 and p-SQSTM1, in the kidneys from LC3-mice with GOX and/or rapamycin (n = 5/group). (D) TEM images. Arrows indicate autolysosomes. M, mitochondria; L, lysosome. (E) Relative protein density, determined by western blotting of RPS6KB1/p70S6K, p-RPS6KB1/p70S6K, ULK1, p-ULK1, and nuclear and cytoplasmic TFEB in kidneys from LC3-mice with GOX and/or rapamycin (n = 5/group). (F) Gene expression of Lamp1 and Uvrag-DT in kidneys extracted from LC3-mice with GOX and rapamycin injection (n = 5). (G) Amount of crystals formed in kidneys extracted from LC3-mice after GOX and/or rapamycin injection (n = 5/group). Scale bars: 20 μm (B), 10 μm (A), and 0.5 μm (D). Each value at 0 d (GOX without rapamycin) was adjusted to ‘1’ as a reference (C, E). *P < 0.05 versus GOX 0 h, #P < 0.05, and †P < 0.05 versus GOX + rapamycin 0 h.
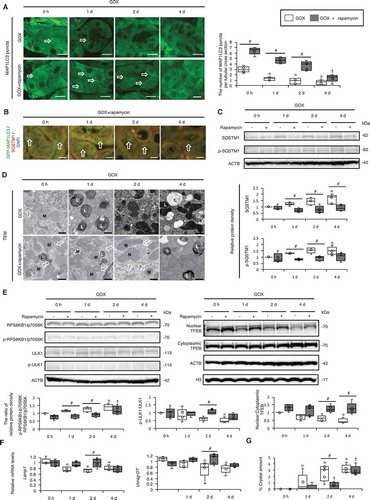
Figure 7. Impaired autophagic flux in mucosa with plaques compared with that in normal mucosa in kidney stone formers. (A) Kidney mucosa biopsy samples obtained from normal and plaque-covered areas of CaOx stone formers were analyzed. Endoscopic- and polarized-light scope images of the mucosa of plaque-covered and normal areas are shown. (B) These mucosa samples were stained with hematoxylin and eosin (HE) and immunostained for LAMP1, SQSTM1, and p-SQSTM1. (C) TEM images of the mucosa in plaque-covered and normal areas are shown. Scale bars: 1 mm (B), 100 μm (A), 5 μm (C; I and IV) and 0.5 μm (C; II, III, V, VI). Arrows indicate autolysosomes. L, lysosome; C, crystal.
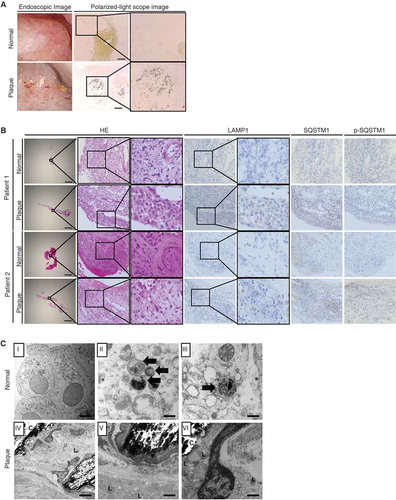
Figure 8. Deregulated MTOR-TFEB axis could be an effective target for kidney stone formation. During kidney stone development, MTOR is activated and nuclear TFEB expression is suppressed, impairing autophagy. Ablation of autophagy causes accumulation of damaged organelles. This enhances the inflammatory response, which facilitates crystal-cell interactions and promotes kidney stone formation. Therefore, autophagy defect caused by deregulation of the MTOR-TFEB axis could be an effective target for kidney stone formation. An MTOR inhibitor, TFEB inducer, or autophagy inducer could suppress the development of kidney stones.
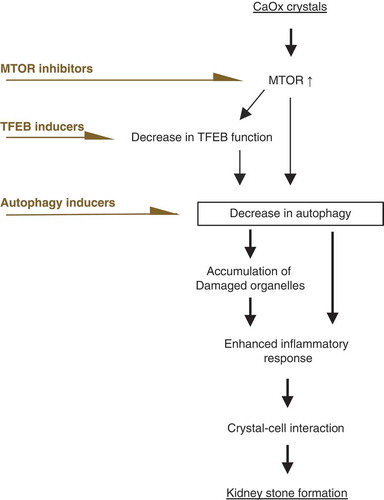
Table 1. Antibodies used in this study.
Table 2. TaqMan primers used for quantitative reverse transcription polymerase chain reaction.