Figures & data
Figure 1. Therapeutic approach and purification of rhCTSD. A Scheme showing that CTSD activity is essential for the degradation of autophagic cargo under normal conditions (top panel) and its deficiency leads to impairment of autophagy (middle panel). We hypothesize that this blockage in autophagy can be corrected by providing exogenous recombinant human pro-CTSD (rhCTSD, lower panel). B Scheme of the production and purification procedure for rhCTSD: (1) rhCTSD secreted into the cell culture media by high producing clone of HEK-EBNA cells stably overexpressing proCTSD; (2) collection of the media supernatant followed by filtration and concentration of the protein; (3) nickel-affinity chromatography of the His-tagged proCTSD; (4) size-exclusion chromatography. C Top: elution profile of nickel-affinity purification of rhCTSD (protein absorbance at 280 nm [a.u.]). His-tagged rhCTSD is eluted by washing with 250 mM imidazole in PBS (red line, right axis). Bottom: Coomassie brilliant blue protein staining of the affinity chromatography fractions. D Top: Elution profile of the size-exclusion chromatography purification of rhCTSD (protein absorbance at 280 nm [a.u.]). Bottom: Coomassie protein staining and CTSD immunoblot of size-exclusion chromatography fractions. Only fractions containing monomeric rhCTSD were pooled and used for further studies.
![Figure 1. Therapeutic approach and purification of rhCTSD. A Scheme showing that CTSD activity is essential for the degradation of autophagic cargo under normal conditions (top panel) and its deficiency leads to impairment of autophagy (middle panel). We hypothesize that this blockage in autophagy can be corrected by providing exogenous recombinant human pro-CTSD (rhCTSD, lower panel). B Scheme of the production and purification procedure for rhCTSD: (1) rhCTSD secreted into the cell culture media by high producing clone of HEK-EBNA cells stably overexpressing proCTSD; (2) collection of the media supernatant followed by filtration and concentration of the protein; (3) nickel-affinity chromatography of the His-tagged proCTSD; (4) size-exclusion chromatography. C Top: elution profile of nickel-affinity purification of rhCTSD (protein absorbance at 280 nm [a.u.]). His-tagged rhCTSD is eluted by washing with 250 mM imidazole in PBS (red line, right axis). Bottom: Coomassie brilliant blue protein staining of the affinity chromatography fractions. D Top: Elution profile of the size-exclusion chromatography purification of rhCTSD (protein absorbance at 280 nm [a.u.]). Bottom: Coomassie protein staining and CTSD immunoblot of size-exclusion chromatography fractions. Only fractions containing monomeric rhCTSD were pooled and used for further studies.](/cms/asset/f4a79c8d-12c5-47a9-ac26-cd7642643218/kaup_a_1637200_f0001_oc.jpg)
Figure 2. In vitro uptake of rhCTSD by mouse embryonic fibroblasts (MEFs). A Immunoblot of CTSD-deficient MEFs after incubation with 20 µg/mL rhCTSD for different periods (0.5–48 h). B Immunocytochemistry of CTSD and LAMP1 in CTSD-deficient MEFs after 24 h incubation with 20 µg/mL rhCTSD. Scale bar: 20 µm. C CTSD activity assayed with artificial fluorescent substrate in CTSD-deficient MEFs incubated with 20 µg/mL rhCTSD for different periods (0.5–48 h). D Immunoblot of CTSD-deficient MEFs after co-incubation with rhCTSD 20 µg/mL and 10 mM mannose-6-phosphate (M6P), 50 mM mannose (Mann) or 750 nM LRP1/LDLR agonist LRPAP1 for 6 h.
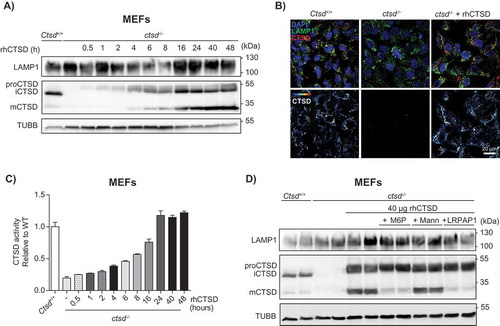
Figure 3. In vivo uptake of rhCTSD by CTSD-deficient mice. A Scheme of the intravenous injection (i.v.) of 25 mg/kg rhCTSD in the tail vein of P20 ctsd-/- mice and sacrifice for organ collection after different time points (2–48 h). B Immunoblot of CTSD plasma levels at different time points after rhCTSD i.v. injection. C Immunoblot of CTSD protein levels and D CTSD activity (relative to WT) in the liver of ctsd-/- mice at different time points after rhCTSD i.v. injection. E Immunoblot of CTSD protein levels and F CTSD activity (relative to WT) in the brain of ctsd-/- mice at different time points after rhCTSD i.v. injection.
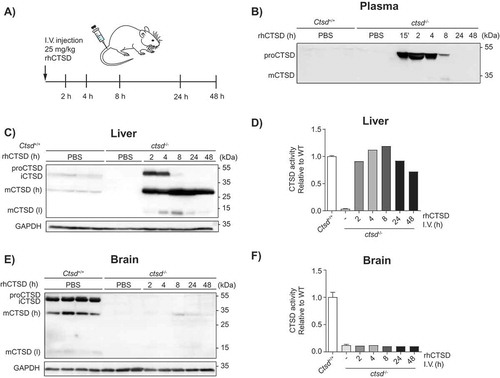
Figure 4. ERT with rhCTSD in CLN10 mice. A Scheme of the rhCTSD injection schedule in ctsd-/- mice. Mice received an initial intraperitoneal (i.p.) injection of 50 mg/kg rhCTSD between P3-5, followed by a bi-weekly i.p. injection of 25 mg/kg and a final intravenous 25 mg/kg injection. Animals were sacrificed at P23. B CTSD (relative to WT) and HEXB (mU/mg) activity in lysates of liver of ctsd-/- mice treated with rhCTSD and age-matched controls. Data (n = 3-5, mean ± S.E.M.) were analyzed using an unpaired t-test. * P < 0.05, ** P < 0.01, *** P < 0.001, **** P < 0.0001. C Immunoblot of liver of P23 ctsd-/- mice treated with rhCTSD and age-matched PBS-injected controls. D Immunohistochemistry of liver of P23 ctsd-/- mice treated with rhCTSD and age-matched PBS-injected controls. Top panel – bright-field images of liver sections stained with toluidine blue (TB). Scale bar: 50 µm. White arrows show large empty spaces indicative of tissue damage. Middle panel – Immunohistochemistry of LAMP1 and CTSD. Nuclei are stained with DAPI. Scale bar: 40 µm. Bottom panels – immunostaining of SAPC and immune cell markers CD68 and AIF1/IBA1. Scale bar: 120 µm. White arrows indicate enlarged AIF1-positive Kupffer cells. E Immunoblot of spleen of P23 ctsd-/- mice treated with rhCTSD and age-matched PBS-injected controls. F Bright-field images of spleen sections of P23 ctsd-/- mice treated with rhCTSD and age-matched PBS-injected controls stained with TB. Scale bar: 20 µm. Black arrows indicate large abnormal vacuoles in macrophages of the red pulp.
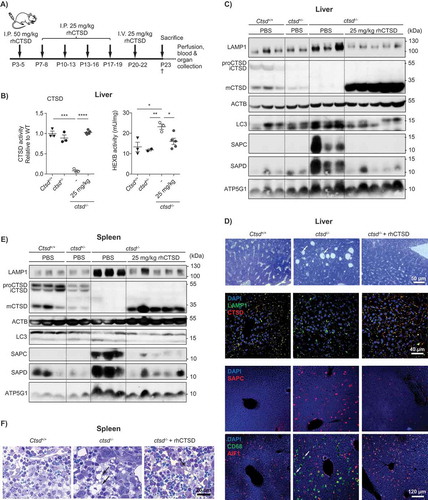
Figure 5. ERT with rhCTSD in murine hippocampal brain slices and retinas of CTSD-deficient mice. A Immunoblot of day in vitro (DIV) 10 hippocampal organotypic slices of ctsd-/- mice and controls treated with rhCTSD for 5 d. B Quantification of the LC3-II protein levels relative to GAPDH in organotypic brain slices treated with rhCTSD. C Quantification of the ratio LC3-II:LC3-I proteins in organotypic brain slices treated with rhCTSD. Data (n = 2-4, mean ± S.E.M.) were analyzed using an unpaired t-test. * P < 0.05, ** P < 0.01. D Immunohistochemistry showing CTSD and CD68 in the retina of PBS- (LA) and rhCTSD- (RA) injected eyes of P23 CTSD-deficient mice. Scale bar: 50 µm. E Quantification of the number of CD68-positive cells in the retina of PBS- and rhCTSD-injected CTSD-deficient eyes. Data (n = 5, mean ± S.E.M.) were analyzed using an unpaired t-test. * P < 0.05. F DAPI staining of WT and ctsd-/- retinas at P23 (i,ii). Indicated are the different cellular retinal layers: outer nuclear layer (onl), inner nuclear layer (inl), inner plexiform layer (ipl) and ganglion cell layer (gcl). Immunostaining of SAPD (iii, iv), ATP5G1 (v,vi), LAMP1 (vii,viii), LAMP2 (ix,x) and SQSTM1 (xi,xii) in the retina of PBS- (LA) or rhCTSD- (RA) injected eyes of P23 CTSD-deficient mice. Scale bar: 50 µm.
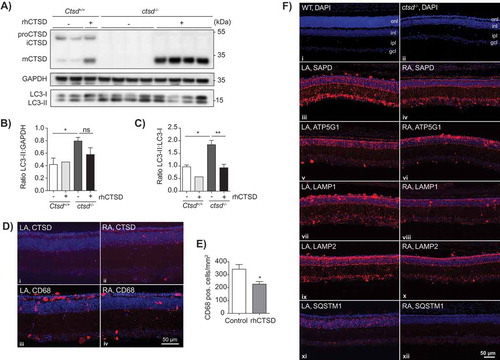
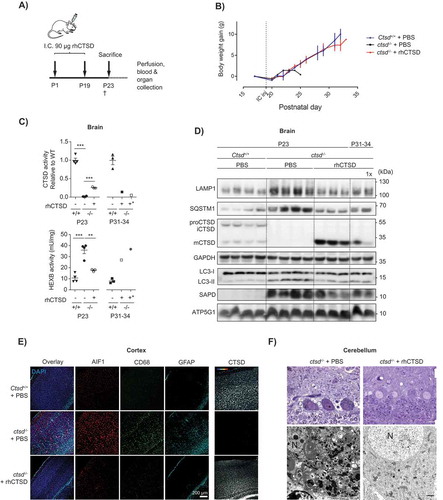
Figure 6. ERT by i.c. injection of rhCTSD in CTSD-deficient mice. A Scheme of the rhCTSD injection schedule in ctsd-/- mice. Mice received an initial intracranial (i.c.) injection of 90 µg rhCTSD (in 10 µL) at P1 (in the right hemisphere) followed by a similar second i.c. injection at P19 (in the left hemisphere). Animals were sacrificed at P23. B Body weight gain (grams) of ctsd-/- mice that received 2 i.c. injections of rhCTSD and PBS-injected WT and ctsd-/- controls. The time point of the second i.c. injection is indicated with a dotted line. C CTSD (relative to WT) and HEXB (mU/mg) activity in lysates of brains of ctsd-/- mice treated with rhCTSD by i.c. and age-matched PBS-injected controls. Data (n = 3–4, mean ± S.E.M.) were analyzed using an unpaired t-test. ** P < 0.01, *** P < 0.001. D Immunoblot of brains of P23 ctsd-/- mice treated with rhCTSD by i.c. injections and age-matched PBS-injected controls. E Immunohistochemistry of the cortex of P23 ctsd-/- mice treated with rhCTSD and age-matched PBS-injected controls. Shown are immune cell markers CD68 and AIF1, astrocyte marker GFAP and CTSD. Nuclei are stained with DAPI. Scale bar: 200 µm. F Top panels: semithin sections (toluidine blue staining) of the cerebellum (Purkinje cells) of PBS and rhCTSD i.c. injected ctsd-/- mice at P23. Scale bar: 10 µm. Bottom panels: electron microscopy pictures of Purkinje cells of PBS and rhCTSD i.c. injected ctsd-/- mice at P23. N, nucleus. Scale bar: 1000 nm.