
Figures & data
Figure 1. pHuji-LC3B as autophagic marker. RPE-1 pHuji-LC3B stable transfectants were incubated with pre-warmed Live Cell Imaging Solution without amino acids for starvation and subjected to live cell fluorescence imaging using an OMX widefield microscope with red filter settings (excitation 568 nm, emission 609/37 nm). Images were recorded during starvation (A) and every 7 min, with images at 21 min (B) and 70 min (C) shown. After 70 min, NH4Cl was added to a final concentration of 10 mM (D). Note the large number of structures that become fluorescent after NH4Cl addition. The imaging series is representative of 37 independent recordings.
Figure 2. Transient autophagosomal recruitment of CHMP4B during starvation-induced autophagy. RPE-1 cells stably expressing pHuji-LC3B, CHMP4B-EGFP and SNAP-RAB5/7 were seeded 1 d before the experiment, washed 3 times with EBSS buffer, and imaged in live-cell imaging solution using an OMX Blaze widefield microscope. Images were recorded every 8 s. (A), single cell at time 0, (B), inset at time 0 with an endosome positive for CHMP4B (i) indicated. (C), inset at time 07:12 with a newly formed CHMP4B-positive autophagic structure (ii) and an amphisome (iii) indicated. (D) shows a detailed tracking of vesicle ii. Normalized fluorescence intensities over time of one representative track out of 19 tracks from 4 independent experiments. Tdwell indicates the calculated dwell time of CHMP4B. (E), dot plot of dwell times from all experiments. Mean value ± SD is indicated with black lines, and median value with a red line.
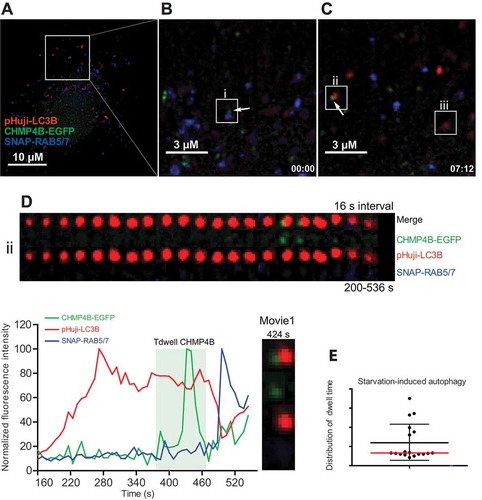
Figure 3. Transient mitophagosomal recruitment of CHMP4B during starvation. RPE-1 cells stably expressing CHMP4B-EGFP and pHuji-LC3B were transiently transfected for 24 h with SNAP-Tom70. At the day of experiment, cells were incubated with SNAP-Cell 647-SiR for 30 min, then washed with EBSS 3 times and incubated in EBSS for 30 min, before transfer to live imaging solution for live microscopy. Images were recorded every 3 s for 15 min. (A), single cell at time 0, (B), inset at time 0 with an LC3B-surrounded mitochondrion is indicated. (C), inset at time 03:00 showing CHMP4B recruitment to mitophagosome i. (D), tracking of mitophagic profile i at 10 s intervals for 290 s. Normalized fluorescence intensities over time of one representative track out of 19 tracks from 2 independent experiments. Tdwell indicates the calculated dwell time of CHMP4B. (E), dot plot of dwell times from all experiments. Mean value ± SD is indicated with black lines, and median value with a red line.
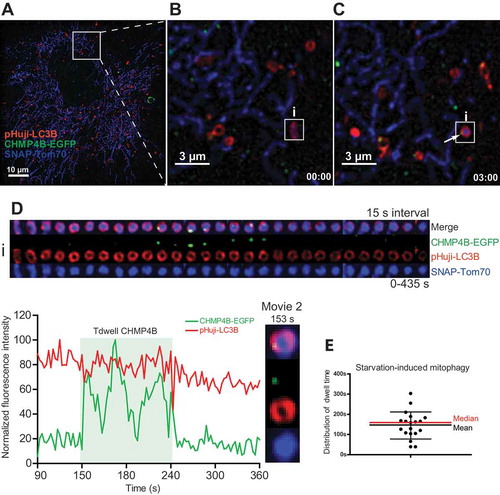
Figure 4. Transient mitophagosomal recruitment of CHMP4B upon DFP treatment. RPE-1 cells stably expressing CHMP4B-EGFP and pHuji-LC3B were transiently transfected with SNAP-Tom70 the day before the experiment, then incubated with 1 mM DFP for 12 h. The DFP-treated cells were incubated with SNAP-Cell 647-SiR for 30 min, then washed with EBSS 3 times and incubated for 30 min in EBSS and transferred to live imaging buffer containing 20 mM glucose for live microscopy. Images were recorded every 2 s for 15 min. (A), single cell at time 0, (B), inset at time 0 with 2 LC3B-surrounded mitochondria (i,ii) indicated. (C), inset at time 03:22 showing CHMP4B recruitment to mitophagosome ii. Note that the CHMP4B-positive structure close to i is a separate vesicle, probably an endosome passing by. (D), tracking of mitophagic profile ii at 3 s intervals for 240 s. Normalized fluorescence intensities over time of one representative track out of 48 tracks from 5 independent experiments. Tdwell indicates the calculated dwell time of CHMP4B. (E), dot plot of dwell times from all experiments. Mean value ± SD is indicated with black lines, and median value with a red line.
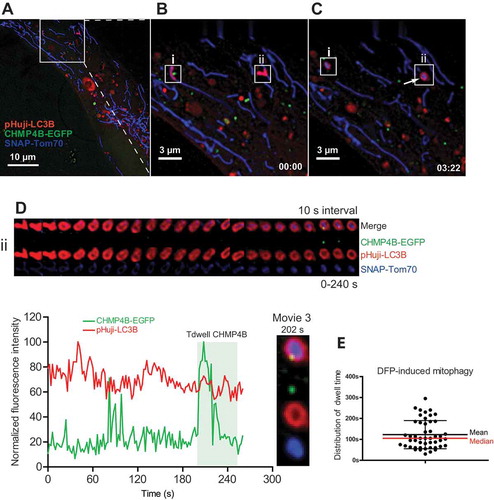
Figure 5. Ultrastructural analysis of CHMP4B recruitment during mitophagy. RPE-1 cells stably expressing CHMP4B-EGFP and pHuji-LC3B were transiently transfected with SNAP-Tom70 the day before the experiment, then incubated with 1 mM DFP for 12 h. Cells were fixed and Airyscan confocal images were obtained using a Zeiss LSM880 Airyscan microscope. Structures positive for CHMP4B-EGFP, pHuji-LC3B and SNAP-Tom70 were identified and studied by correlative light/electron microscopy and electron tomography in a 200 kV Talos electron microscope (Thermo Fisher). Single optical sections of Airyscan micrographs are shown in (A) (optical section no. 4) and (B) (optical section no. 3). The boxed area in (A) is shown magnified and overlaid on the electron micrograph (B). Three consecutive serial sections (200 nm each) of this area are shown in panels (C), (D) and (E), with 7 structures annotated. The lower panels, (F) and (G), show tomogram slices of the indicated structures (1 and 4) at high magnification with the correlative localization of the CHMP4B-EGFP signal (F). Structure no. 4 is a mitochondrion (blue) surrounded by LC3B-positive membranes (red), and recruited CHMP4B-EGFP (green) is visible in the Airyscan micrograph (A), left inset, and the Imaris 3D-rendering (A), right inset, and also indicated in the CLEM montage (B). Different tomogram sections of structure no. 4 at higher magnification are shown in Suppl.Fig. S5. Scale bars as indicated. Tomogram pixel size 1.5 nm.
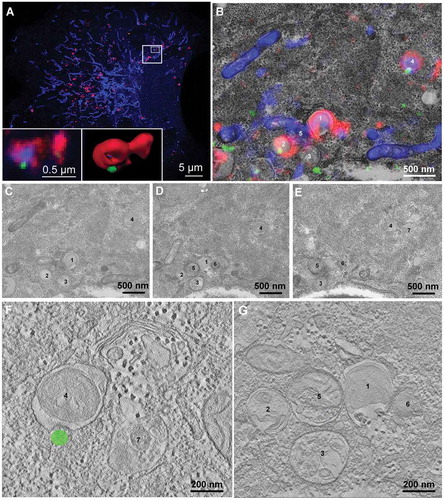
Figure 6. Sustained mitophagosomal recruitment of CHMP4B upon CHMP2A depletion. RPE-1 cells stably expressing CHMP4B-EGFP and pHuji-LC3B were transfected with siRNA against CHMP2A for 48 h and then transiently transfected with SNAP-Tom70 before incubation with 1 mM DFP for 12 h. The DFP-treated cells were incubated with SNAP-Cell 647-SiR for 30 min, then washed with EBSS 3 times and incubated for 30 min in EBSS and transferred to live-cell imaging buffer containing 20 mM glucose. Images were recorded every 3 s for 15 min. (A), single cell at time 0, with example of CHMP4B-containing mitophagosome (i) indicated. The increase in CHMP4B-EGFP and pHuji-LC3B signal during the first frames is due to focal movement. (B), the same cell at time 0:45. (C), the same cell at time 11:18. (D), tracking of mitophagosome i over 320 s. Normalized fluorescence intensities over time of one representative track out of 15 tracks from 2 independent experiments. Relative amplitude differences between different trackings are related to the different total fluorescence intensities. (E), western blot showing the efficiency of CHMP2A knockdown.
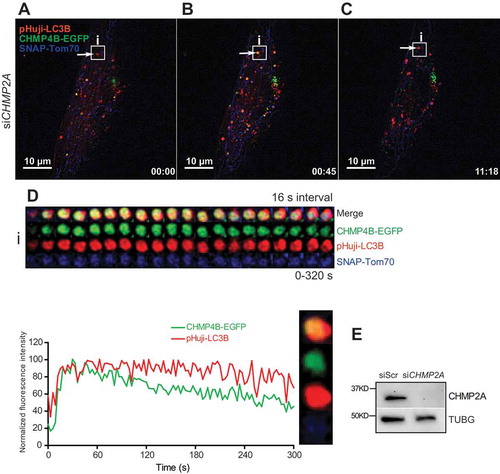
Figure 7. Optogenetic assay of mitophagosome closure. (A), Schematic representation of the optogenetic mitophagosome closure assay. Labelling of mitochondria as cargo was achieved by expression of NTOMM20-LOV2 and Cherry-Zdk1. Upon exposure of cells to 488 nm wavelength light, the mCherry-Zdk1 probe reversibly dissociates from the NTOMM20-LOV2 into the cytoplasm. With time mCherry-Zdk1 associates again with the LOV2-domain. Upon closure of autophagosomes during mitophagy around mitochondria, the release of mCherry-Zdk1 is inhibited and the mitochondria remain fluorescent. If closure is inhibited, mCherry fluorescence is transiently lost. Using this system unclosed autophagosomes should be observed by fluctuations in mCherry fluorescence intensity upon repeated pulses of light exposure. (B), RPE-1 cells stably expressing SNAP-LC3B and transiently expressing NTOMM20-LOV2 and mCherry-Zdk1 were treated with DFP. Live cell imaging was performed to follow autophagosome formation around damaged mitochondria. Cells were imaged every 2 s and exposed to 488 nm light every 12 time points. Fluorescence intensity was measured for each track and the corresponding gallery added. Time points of light exposure are indicated by the orange triangle.
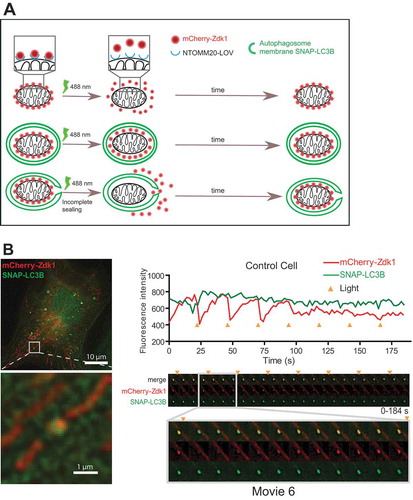
Figure 8. CHMP2A depletion inhibits mitophagosome closure. (A, B), Example galleries and vesicle tracks for mitophagy closure assay. Cells stably expressing SNAP-LC3B and transiently expressing NTOMM20-LOV2 and Cherry-Zdk1 were treated with DFP. Live cell imaging was performed to follow autophagosome formation around damaged mitochondria. Cells were imaged every 2 s and exposed to 488 nm light every 12 time points. Fluorescence intensity was measured for each track and the corresponding gallery added for a scrambled siRNA transfected cell (A) and a CHMP2A knockdown cell (B). Time points of light exposure are indicated by the orange triangle. (C), Graph comparing the amount of closed autophagosomes to open autophagosomes in cells treated with control scrambled siRNA or CHMP2A siRNA. Data represent tracking of 19 profiles for control siRNA- and 40 profiles for CHMP2A siRNA-treated cells from 2 independent experiments. (D), Knockdown efficency of CHMP2A as detected by western blotting for 2 live cell imaging experiments.
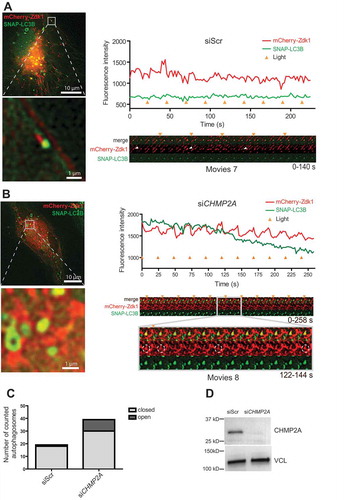
Figure 9. ESCRT depletion inhibits mitophagy. ((A), U2-OS cells expressing the MLS-EGFP-mCherry probe were treated with the indicated siRNAs for 24 h, then incubated with DFP for 24 h, and mitophagy was measured as described in Materials and Methods. Representative microscopy images are shown to the left, and the quantifications based on 3 independent experiments are shown to the right. Knockdown efficiency, as determined by real-time PCR, is shown in Suppl. Fig. S7. An illustration of the principle of the assay is included. (B), U2-OS cells expressing the MLS-EGFP-mCherry probe and PRKN were treated with the indicated siRNAs for 24 h, then incubated with oligomycin and antimycin A (O + A) for 6 h, and mitophagy was measured as described in Materials and Methods. Examples of microscopy images are shown to the left, and the quantifications based on 3 independent experiments are shown to the right.
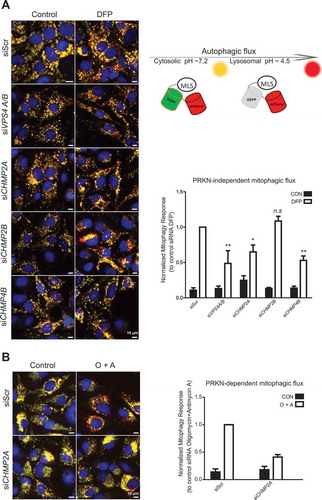
Figure 10. CHMP2A or CHMP4B depletion inhibits PRKN-dependent mitophagic protein degradation. U2-OS cells expressing PRKN were treated with scrambled siRNA or siRNA against CHMP2A (A) or CHMP4B (B) and incubated with or without oligomycin (10 μM), antimycin A (1 μM) and bafilomycin A1 (100 nm) at 37°C for 12 h, and cell lysates were analyzed by SDS-polyacrylamide gel electrophoresis followed by western blotting (middle panel) against MT-CO2. Antibodies against VCL and TUBG were used as loading controls. The V-ATPase inhibitor bafilomycin A1 was used to evaluate the importance of acidification and thus membrane closure for MT-CO2 degradation. Quantifications from 3 independent experiments are shown in the lower panel, with mean values ± SEM indicated. *, p < 0.05; **, p < 0.005.
Table 1. siRNA oligonucleotides used.
Table 2. Primers used for qPCR.