Figures & data
Figure 1. Characterization of PPRV-triggered autophagosome accumulation. (A and B) EECs were mock-infected or infected with PPRV (MOI = 3) for 1.5, 3, 6, 9, 12 or 24 h. At the end of the infection period, the LC3, SQSTM1, PPRV-N, and ACTB (loading control) expression levels were analyzed by immunoblotting with specific antibodies. (C) The LC3-II levels relative to the ACTB levels were determined by densitometry. (D) The SQSTM1 levels relative to the ACTB levels were determined by densitometry. (E) The PPRV-N levels relative to the ACTB levels were determined by densitometry. (F) EECs were infected with PPRV (MOI = 3) for 1.5, 3, 6, 9, 12 or 24 h. The viral titers were measured using the TCID50 method. The data represent the mean ± SD of three independent experiments. Two-way ANOVA; *P < 0.05; ***P < 0.001; #P > 0.05.
Figure 2. PPRV induces two waves of autophagy via distinct and uncoupled molecular pathways. (A and B) EECs were mock-infected or infected with PPRV or UV-irradiated PPRV (MOI = 3) for 1.5 or 12 h. The cell samples were fixed and processed for electron microscopy analysis. Scale bars, 1 μm. Magnified views of the autophagosome-like vesicles are enclosed by black square frames. Scale bars, 200 nm. (C) EECs were mock-infected or infected with PPRV or UV-irradiated PPRV (MOI = 3) for 1.5 or 12 h. The cell samples were analyzed by immunoblotting with anti-LC3, anti-SQSTM1, anti-PPRV-N and anti-ACTB (loading control) antibodies. The target protein levels relative to the ACTB levels in the mock-, UV-irradiated PPRV- and PPRV-infected EECs were determined by densitometry. (D) EECs were treated with si-control, si-ATG5 or si-GOPC and infected with PPRV (MOI = 3) for 1.5 or 12 h. The cell samples were analyzed by immunoblotting with anti-LC3, anti-SQSTM1, anti-PPRV-N and anti-ACTB (loading control) antibodies. The target protein levels relative to the ACTB levels in the siRNA-transfected cells were determined by densitometry. (E) EECs were treated with chloroquine and infected with PPRV (MOI = 3) for 1.5, 3 or 6 h. The cell samples were analyzed by immunoblotting with anti-LC3, anti-SQSTM1 and anti-ACTB (loading control) antibodies. The target protein levels relative to the ACTB levels in the treated cells were determined by densitometry. The data represent the mean ± SD of three independent experiments. Two-way ANOVA; *P < 0.05; **P < 0.01; ***P < 0.001; #P > 0.05.
Figure 3. The role of the AKT-MTOR pathway in PPRV-induced autophagy in host cells. (A and B) EECs were mock-infected or infected with PPRV (MOI = 3). The cells were harvested at 1.5, 3, 6, 9, 12 and 24 h and then immunoblotted with anti-p-MTOR, anti-MTOR, anti-p-AKT, anti-AKT, and anti-ACTB antibodies. (C) The p-MTOR levels relative to the MTOR levels were determined by densitometry. (D) The p-AKT levels relative to the AKT levels were determined by densitometry. (E and F) EECs were pre-treated with INS (1 μM) for 6 h prior to viral infection. Then, the cells were infected with PPRV or UV-irradiated PPRV (MOI = 3) for 1.5 or 12 h. The cell samples were analyzed by immunoblotting with anti-p-MTOR, anti-MTOR, anti-p-AKT, anti-AKT, anti-LC3, anti-PPRV-N and anti-ACTB (loading control) antibodies. (G) The relative target protein levels in the INS-pre-treated cells at 1.5 hpi were determined by densitometry. (H) The relative target protein levels in the INS-pre-treated cells at 12 hpi were determined by densitometry. The data represent the mean ± SD of three independent experiments. Two-way ANOVA; **P < 0.01; ***P < 0.001; #P > 0.05.
Figure 4. PPRV-H and NECTIN4 are sufficient to induce the first wave of autophagy via AKT and MTOR dephosphorylation. (A) His-tagged V, H and N were expressed in E. coli BL-21 and purified using Ni-NTA columns. The purified products were separated using SDS-PAGE and analyzed by immunoblotting with an anti-His antibody. (B) EECs were transfected with GFP-LC3 for 24 h and incubated with 100 ng/mL His-GST, His-V, His-H, or His-N for 1.5 h. Autophagy was monitored by evaluating the number of GFP+-LC3 vesicles per cell profile by confocal immunofluorescence microscopy. Scale bars, 20 μm. (C) Corresponding graph representing the numbers of GFP+-LC3 vesicles per cell profile in EECs pre-treated with His-GST, His-V, His-H, or His-N. (D) EECs were cultured in DMEM/F12 supplemented with 2% fetal bovine serum containing His-GST, His-V, His-H or His-N for 1.5 h and analyzed by immunoblotting with anti-LC3, anti-SQSTM1, anti-p-MTOR, anti-MTOR, anti-p-AKT, anti-AKT, and anti-ACTB (loading control) antibodies. The relative target protein levels were determined by densitometry in His-GST, His-V, His-H and His-N pre-treated cells. (E) EECs were treated with si-control or si-NECTIN4 and infected with PPRV (MOI = 3) for 1.5 h. The cell samples were analyzed by immunoblotting with anti-LC3, anti-SQSTM1, anti-p-MTOR, anti-MTOR, anti-p-AKT, anti-AKT, anti-NECTIN4 and anti-ACTB (loading control) antibodies. The relative target protein levels in the siRNA-transfected cells were determined by densitometry. The data represent the mean ± SD of three independent experiments. Two-way ANOVA; **P < 0.01; ***P < 0.001; #P > 0.05.
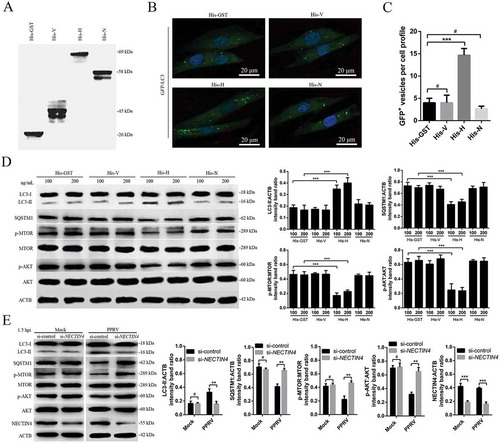
Figure 5. PPRV-H binding to NECTIN4 triggers autophagy via AKT-MTOR dephosphorylation. (A) Co-IP assay results demonstrating that endogenous NECTIN4 binds to H-HA in transfected cells. EECs were transfected with pCDNA3.1-H-HA for 48 h and harvested. Cell lysates from transfected cells and untransfected control cells were immunoprecipitated with an antibody against HA and then subjected to immunoblotting. (B) Exogenous NECTIN4-Flag and H-HA coexpression in EECs. Cell lysates from cells co-transfected with NECTIN4-Flag and H-HA or transfected with NECTIN4-Flag alone were immunoprecipitated with an antibody against HA and then subjected to immunoblotting. (C) Results of reciprocal co-IP experiments showing that the anti-Flag antibody precipitated H-HA. (D) EECs were transfected with pCDNA3.1-NECTIN4-Flag for 48 h and then infected with PPRV (MOI = 3) for 1.5 or 3 h. Cell lysates from the transfected cells were immunoprecipitated with an antibody against Flag and then subjected to immunoblotting. (E) EECs were transfected with pCDNA3.1-NECTIN4-Flag for 48 h and then incubated with 100 ng/mL His-GST, His-V, His-H, or His-N for 1.5 h. Cell lysates from the transfected cells were immunoprecipitated with an antibody against Flag and then subjected to immunoblotting. (F) Immunoblotting was performed using anti-LC3 and anti-SQSTM1 antibodies on lysates from EECs cultured in uncoated plates or in plates coated with anti-NECTIN4 or an irrelevant isotype control IgG for 4 h at 37°C. The target protein levels relative to the ACTB levels in cells pre-treated with anti-NECTIN4 or an irrelevant isotype control IgG were determined by densitometry. (G) EECs were transfected with GFP-LC3 for 24 h and cultured in plates coated with the irrelevant isotype control IgG or anti-NECTIN4 for 4 h. Autophagy was monitored by evaluating the number of GFP+-LC3 vesicles per cell profile by confocal immunofluorescence microscopy. Scale bars, 20 μm. The corresponding graph shows the number of GFP+-LC3 vesicles per cell profile among the EECs pre-treated with anti-NECTIN4 or the irrelevant isotype control IgG. (H) EECs were incubated with His-GST, a mixture of His-GST and NECTIN4 (His-GST:NECTIN4 = 1:3), a mixture of His-H and NECTIN4 (His-H:NECTIN4 = 1:3), or His-H for 1.5 h and analyzed by immunoblotting with anti-p-MTOR, anti-MTOR, anti-p-AKT, anti-AKT, anti-LC3, and anti-ACTB (loading control) antibodies. The relative target protein levels in the pre-treated cells were determined by densitometry. (I) EECs were incubated with His-GST (100 ng/mL) or His-H (100 ng/mL) and PPRV for 1.5 h at 37°C or 4°C. The cells were analyzed by immunoblotting with anti-p-MTOR, anti-MTOR, anti-p-AKT, anti-AKT, anti-LC3, and anti-ACTB (loading control) antibodies. The relative target protein levels in the pre-treated cells were determined by densitometry. The data represent the mean ± SD of three independent experiments. Two-way ANOVA; **P < 0.01; ***P < 0.001; #P > 0.05.
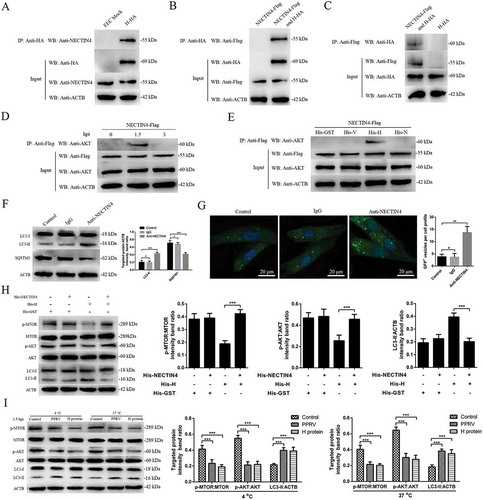
Figure 6. The second wave of autophagy induced by PPRV depends on IRGM and HSPA1A. (A and B) EECs were mock-infected or infected with PPRV (MOI = 3) for 1.5 or 12 h. At the end of the infection period, the IRGM, HSPA1A and ACTB (loading control) expression levels were analyzed by immunoblotting with specific antibodies. The target protein levels relative to the ACTB levels were determined by densitometry. (C-E) EECs were treated with si-control, si-IRGM or si-HSPA1A and infected with PPRV (MOI = 3) for 1.5 or 12 h. The cell samples were analyzed by immunoblotting with anti-LC3, anti-SQSTM1, anti-PPRV-N and anti-ACTB (loading control) antibodies. The target protein levels relative to the ACTB levels in the siRNA-transfected cells were determined by densitometry. The viral titers were measured using the TCID50 method. (F) GFP-LC3 EECs were treated with si-control, si-IRGM or si-HSPA1A and infected with PPRV (MOI = 3) for 12 h. Autophagy was monitored by evaluating the number of GFP+-LC3 vesicles per cell profile by confocal immunofluorescence microscopy. Scale bars, 20 μm. The corresponding graph shows the number of GFP+-LC3 vesicles per cell profile among the siRNA pre-treated EECs. The data represent the mean ± SD of three independent experiments. Two-way ANOVA; *P < 0.05; **P < 0.01; ***P < 0.001; #P > 0.05.
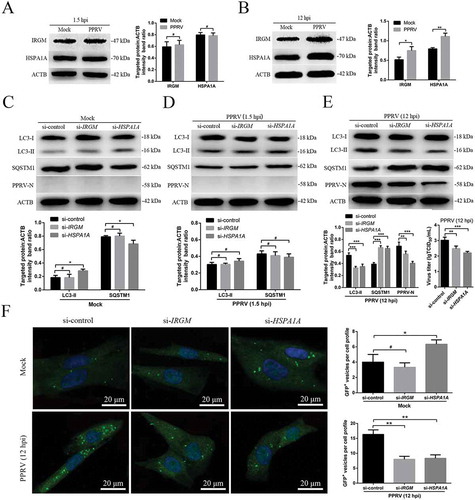
Figure 7. Physical interaction and co-localization of IRGM and HSPA1A with viral proteins. (A and B) Co-IP assay results demonstrating that endogenous IRGM binds C-HA but not N-HA in transfected cells. EECs were transfected with pCDNA3.1-C-HA or pCDNA3.1-N-HA for 48 h and harvested. Cell lysates from the transfected cells and from untransfected control cells were immunoprecipitated with an antibody against HA and then subjected to immunoblotting. (C and D) Co-IP assay results demonstrating that endogenous HSPA1A binds N-HA but not C-HA in transfected cells. EECs were transfected with pCDNA3.1-C-HA or pCDNA3.1-N-HA for 48 h and harvested. Cell lysates from the transfected cells and from untransfected control cells were immunoprecipitated with an antibody against HA and then subjected to immunoblotting. (E) GST pulldown assay results demonstrating the physical and direct interaction between HSPA1A and PPRV-N. Glutathione beads conjugated to GST or a GST-HSPA1A fusion protein were incubated with recombinant N-HA protein. After washing, the proteins were eluted from the beads, and SDS-PAGE was performed. Expression of the N protein was detected by immunoblotting with an anti-HA antibody. GST and GST-HSPA1A protein expression was confirmed by immunoblotting with an anti-GST antibody. (F) IRGM co-localizes with PPRV-C, and HSPA1A co-localizes with PPRV-N. EECs were transfected with pCDNA3.1-C-HA or pCDNA3.1-N-HA for 48 h. The transfected cells were fixed and processed for indirect immunofluorescence analysis using antibodies against HA (green), IRGM (red) and HSPA1A (red). The cell nuclei were counterstained with Hoechst 33342 solution. Scale bars, 20 μm.
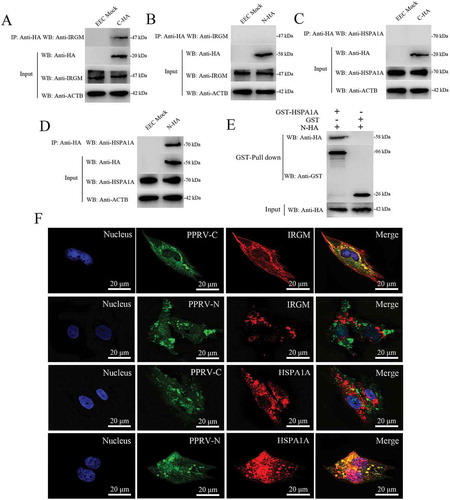
Figure 8. The PPRV-C and PPRV-N proteins modulate autophagy via IRGM and HSPA1A. (A) Overexpression of PPRV-C, PPRV-N or PPRV-C+ PPRV-N modulates autophagosome formation. GFP-LC3 EECs were transfected with a GST-encoding vector (control) or a vector encoding the PPRV-C and/or PPRV-N proteins. Twenty-four h after transfection, the number of autophagic vesicles was determined by confocal immunofluorescence microscopy. Scale bars, 20 μm. (B) The corresponding graph shows the number of GFP+-LC3 vesicles per cell profile among the transfected EECs. (C) PPRV-C and PPRV-N modulate autophagosome formation partly via IRGM-HSPA1A. GFP-LC3 EECs were treated with si-control, si-IRGM or si-HSPA1A 24 h prior to transfection with a vector encoding PPRV-C or PPRV-N. After an additional 24 h, the cells were fixed, and the number of autophagosomes was determined by confocal immunofluorescence microscopy. Scale bars, 20 μm. (D) The corresponding graph shows the number of GFP+-LC3 vesicles per cell profile among the siRNA-pre-treated and transfected EECs. (E and F) EECs were pre-treated and transfected as described in C. Cell samples were analyzed by immunoblotting with anti-LC3, anti-SQSTM1, and anti-ACTB (loading control) antibodies. The target protein levels relative to the ACTB levels in siRNA-pre-treated and transfected EECs were determined by densitometry. The data represent the mean ± SD of three independent experiments. Two-way ANOVA; **P < 0.01; ***P < 0.001.
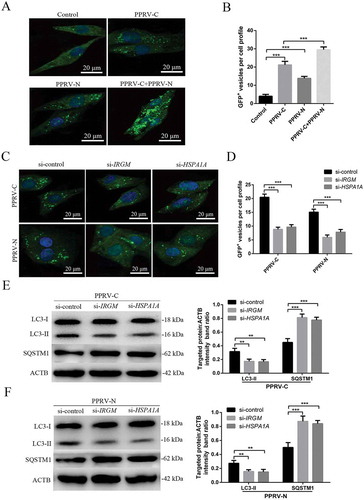
Figure 9. Syncytia formation facilitates sustained autophagy in PPRV-infected EECs. (A) GFP-LC3 EECs treated with DMSO or rapamycin (100 nM) or infected with PPRV (MOI = 3) were further cultured in the absence or presence of 10 μg/mL FIP for 48 h. The number of autophagic vesicles was determined by confocal immunofluorescence microscopy. Scale bars, 20 μm. (B) Corresponding graph showing the number of GFP+-LC3 vesicles per cell profile of FIP-treated EECs. (C) EECs were treated as described in A. Cell samples were analyzed by immunoblotting with anti-LC3, anti-SQSTM1, anti-PPRV-N and anti-ACTB (loading control) antibodies. The target protein levels relative to the ACTB levels in the FIP-treated EECs were determined by densitometry. (D) EECs were treated with FIP and infected with PPRV for 48 h. The viral titers were measured using the TCID50 method. The data represent the mean ± SD of three independent experiments. Two-way ANOVA; *P < 0.05; **P < 0.01; ***P < 0.001; #P > 0.05.
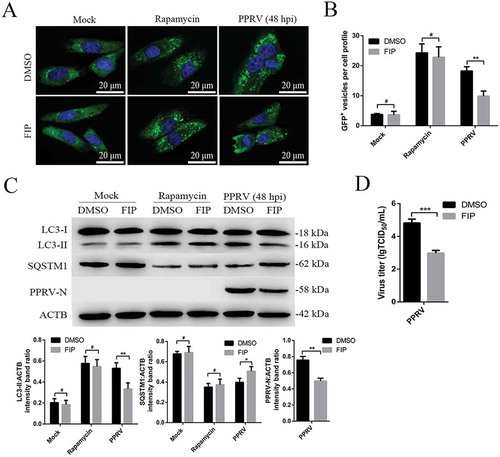
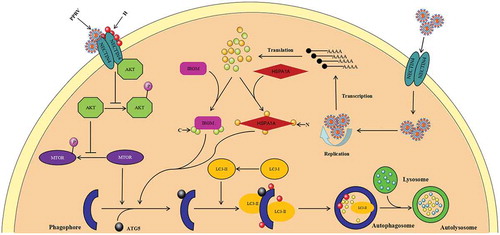
Figure 10. Proposed model of the two waves of autophagy induced by PPRV via distinct pathways. PPRV induces a first transient wave of autophagy via a mechanism involving its cellular receptor NECTIN4 and an AKT-MTOR-dependent pathway. Soon after infection, new autophagic signalling is initiated that requires viral replication and protein expression. The IRGM-HSPA1A pathway is required for the second wave of autophagy induced by PPRV infection.