Figures & data
Figure 1. ER stress is highly induced during M. oryzae infection. (A) RT-PCR analysis of testing UPR-induced MoHAC1 splicing in M. oryzae. RT-PCR was performed using total RNAs extracted from the wild-type stain grown in liquid CM for 2 d and then treated with 10 μM DTT for another 4 h and harvested. For RNA extraction during infection stages, four milliliters of conidial suspension (2 × 10⁵ spores/ml) of Guy11 were sprayed on 2-week-old rice seedlings (Oryza sativa cv. CO39) and the infected leaves were collected and cooled with liquid nitrogen. (B) Expression of uMoHAC1 and sMoHAC1 were analyzed by qRT-PCR in both mycelial and infection stages (2 h and 8 h). ‘HY’: hyphae stage, ‘-’: hyphae without any treatment. (C) The relative expression levels of putative UPR-target genes were analyzed by qRT-PCR and normalized to that of ACTIN. Error bars represent the standard deviations and asterisks represent significant differences (p < 0.01).
Figure 2. DTT imposed ER stress induces autophagy in M. oryzae. (A) The Guy11 (wild-type strain) expressing GFP-MoAtg8 was cultured in MM-N (nitrogen starvation minimal medium) or treated with 10 μM DTT for 0 or 5 h, and the autophagy intensity was observed by Axio Observer A1 Zeiss inverted microscope. The arrow points to the vacuoles. Scale bar: 5 μm. (B) Autophagy intensity was assessed by means of translocation of GFP-MoAtg8 into vacuoles (n = 100). Bars with asterisks represent significant differences (Duncan’s new multiple range method p < 0.01). (C) Immunoblotting was performed with anti-GFP and anti-β-Actin antibodies. The extent of autophagy was estimated by calculating the amount of free GFP compared to the total amount of intact GFP-Atg8 and free GFP (the numbers underneath the blot). (D) Immunoblots were performed with total proteins from hyphae of Guy11 strain without any treatment (CM) or treated with 1 mg/ml CFW, 10 μM DTT and MM-N (nutrient starvation condition). The phosphorylated MoMps1 was detected by binding of P-P44/42 antibody, and the total MoMps1 was detected by the P44/42 antibody as a control.
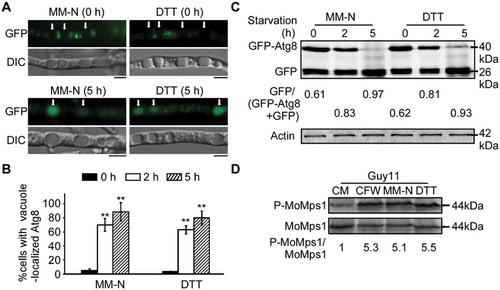
Figure 3. The CWI pathway is important for autophagy. (A) The vacuoles were filled with autophagic bodies in the wild-type Guy11 strain, whereas almost no autophagic body was evident in the vacuoles of Momck1∆, Momkk1∆, and Momps1∆ mutant strains under microscopic observation. The arrow points to the autophagic bodies. V: vacuole, C: cytoplasm. Scale bar: 5 μm. (B) Statistical analysis of vacuole lumens (n = 100) filled with autophagic bodies. Bars with asterisks represent significant differences (Duncan’s new multiple range method p < 0.01). (C) Transmission electron microscopic observation of hypha cultured in nitrogen starvation MM-N medium for 5 h. Scale bar: 0.5 μm. (D) The Guy11 (wild type), Momck1∆, Momkk1∆, and Momps1∆ mutant strains transformed with GFP-MoAtg8 were cultured in MM-N (nitrogen starvation minimal medium) for 5 h, and the autophagy intensity was observed by Axio Observer A1 Zeiss inverted microscope. The arrow points to the vacuole. Scale bar: 5 μm. (E) Autophagy intensity was assessed by means of translocation of GFP-MoAtg8 into vacuoles (n = 100). Bars with asterisks represent significant differences (Duncan’s new multiple range method p < 0.01). (F) Immunoblotting was performed with anti-GFP and anti-β-Actin antibodies. The extent of autophagy was estimated by calculating the amount of free GFP compared to the total amount of intact GFP-Atg8 and free GFP (the numbers underneath the blot).
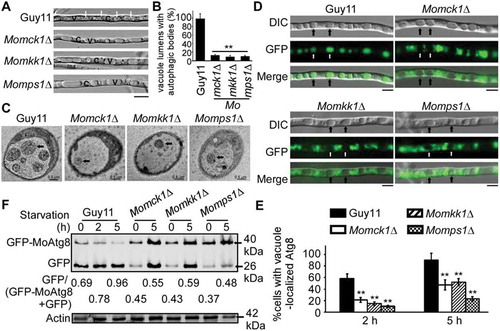
Figure 4. MoAtg1 complex interacts with MoMkk1. (A) Yeast two-hybrid (Y2H) analysis of the interaction between MoMkk1 and MoAtg1 complex (MoAtg1, MoAtg11, MoAtg13, MoAtg17). The pGADT7 and pGBKT7 fused with specific genes were co-introduced into the yeast AH109 strain, and transformants were plated on SD-Leu-Trp as a control and on selective SD-Leu-Trp-His-Ade for 5 d. The pair of plasmids pGBKT7-Lam and pGADT7-T, empty pGADT7 and pGBKT7 were used as the negative controls. (B) BiFC assay for the patterns of MoMkk1-MoAtg1, MoMkk1-MoAtg11, MoMkk1-MoAtg13, MoMkk1-MoAtg17 in vivo. Strains expressing nYFP-MoAtg1 and empty cYFP, MoAtg11-cYFP and empty nYFP, nYFP-MoAtg13 and empty cYFP, nYFP-MoAtg17 and empty cYFP, MoMkk1-nYFP and empty cYFP, MoMkk1-cYFP and empty nYFP were used as negative controls. MoApe1-RFP was used as a phagophore assembly site (PAS) marker. Scale bar: 5 μm.
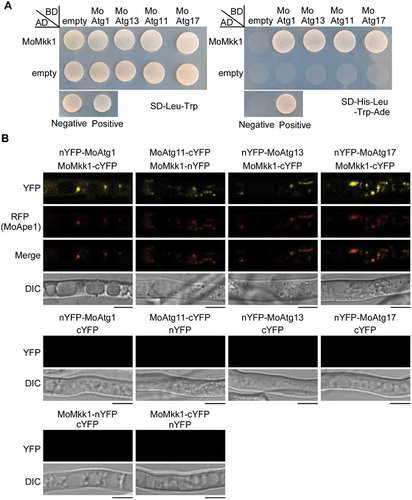
Figure 5. Subcellular localization of MoMkk1 under different conditions. (A) Confocal fluorescence microscope (Zeiss LSM710, 63x oil) observation under different conditions. Nutrient-rich condition (CM) was used for control. Dithiothreitol (DTT) and MM-N treatment for inducing autophagy. The white arrow points to the accumulation sites of MoMkk1 under DTT and MM-N treatment. The black arrow with dotted lines indicated the areas used for linescan graph analysis. MoApe1-RFP was used as a phagophore assembly site (PAS) marker. Scale bar: 5 μm. (B) Linescan graph analysis showing that MoMkk1-GFP presented in a relative steady-state distribution pattern in the cytoplasm under CM condition but obviously gathered to the PAS (MoApe1-RFP) under DTT and nutrient- starvation conditions. ‘left’ and ‘right’ indicated the left and right black arrow with dotted line in (A), respectively.
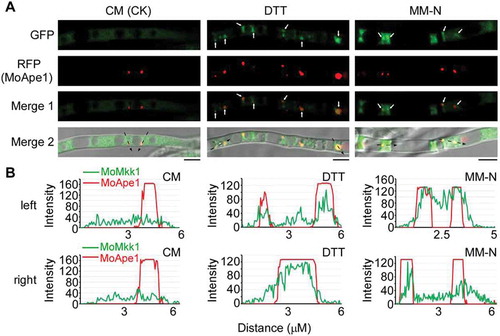
Figure 6. Overexpression of MoATG1, MoATG11, or MoATG17 can restore defects in the Momck1∆ mutant. (A) Growth of the wild type (Guy11), CWI mutant strains (Momck1∆, Momkk1∆, Momps1∆), and MoAtg1 complex overexpression in Momck1∆ and Momkk1∆ mutants on complete medium (CM) for autolysis observation after 2 weeks’ incubation. (B) Statistical of conidia production on SDC medium cultured at 28°C for 7 d in the dark followed by 3 d of continuous illumination under fluorescent light. Asterisks denote statistical significances (p < 0.01). (C) Pathogenicity test on rice leaves. Unwounded rice leaves were incubated with different strains and leaf without any mycelium was used as a control (CK). Diseased leaves were photographed 5 d after inoculation. (D) Detection of the MoMps1 phosphorylation level. The key kinase of the CWI pathway MoMps1 (downstream of MoMkk1) was detected by binding of the P-P44/42 antibody, and the total MoMps1 was detected by the P44/42 antibody as control.
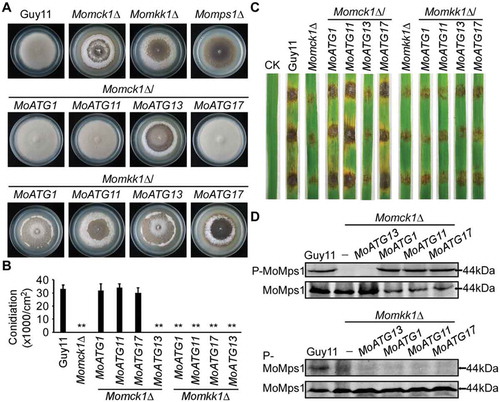
Figure 7. MoMkk1 is phosphorylated by MoAtg1 under overexpression of MoATG1, MoATG11, or MoATG17 conditions. (A) In vivo phosphorylation analysis of MoMkk1. MoMkk1-GFP proteins treated with phosphatase inhibitors were separated by Mn2+-Phos-tag SDS-PAGE and normal SDS-PAGE, respectively, and detected by the GFP antibody. The extent of MoMkk1 phosphorylation was estimated by calculating the amount of phosphorylated-MoMkk1 (P-MoMkk1) compared to the total amount of MoMkk1 (the numbers underneath the blot). (B) In vitro phosphorylation analysis by the fluorescence detection in tube (FDIT) method. Purified proteins of GST-MoMkk1, His-MoAtg1, His-MoAtg11, His-MoAtg17 were used for protein kinase reaction in the presence of 50 μM ATP in a kinase reaction buffer and then dyed with Pro-Q® Diamond Phosphorylation Gel Stain. Fluorescence signal at 590 nm (excited at 530 nm) was measured in a Cytation3 microplate reader (Biotek, Winooski, VT, USA). Asterisks denote statistical significances (p < 0.01). (C) MoMkk1 phosphorylation peptide (SGSFGPLDGR) in the Momck1∆/MoATG1 strain expressing MoMKK1 was identified by mass spectrometer analysis and the phosphorylated site was Ser-115.
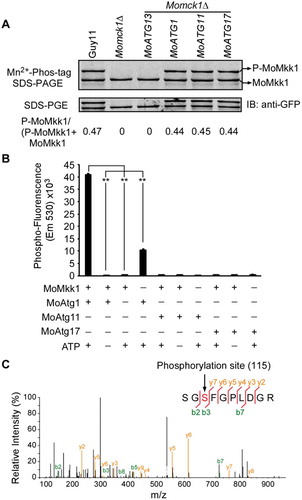
Figure 8. MoAtg1-dependent MoMkk1 phosphorylation is essential for the development and virulence of M. oryzae. (A) Autolysis observation of wild type (Guy11), Momck1∆, Momck1∆/MoMKK1S115D, Momkk1∆, Momkk1∆/MoMKK1S115A, Momkk1∆/MoMKK1, Moatg1∆, Moatg1∆/MoATG1T225A, Moatg1∆/MoATG1 mutant strains on CM medium. (B) Statistical of conidia production on SDC medium cultured at 28°C for 7 d in the dark followed by 3 d of continuous illumination under fluorescent light. Different letters indicate statistically significant differences (Duncan’s new multiple range test, p < 0.01). -: no construct control; S115D: MoMKK1S115D; S115A: MoMKK1S115A; T225A: MoATG1T225A. (C) Pathogenicity analysis using rice spraying assays. Four milliliters of conidial suspension (5 × 10⁴ spores/ml) of each strain were used for spraying and photographed 7 d after inoculation. (D) Diseased leaf area analysis. Data are presented as a bar chart showing the percentage of lesion area analyzed by Image J. Error bars represent SD and asterisks represent significant differences (p < 0.01). (E) Severity of blast disease was evaluated by quantifying M. oryzae genomic 28S rDNA relative to rice genomic Rubq1 DNA (7 d post-inoculation). Mean values of three determinations with standard deviations are shown. The asterisks indicate a significant difference from the wild-type Guy11 (p < 0.01). (F) In vitro phosphorylation analysis of fluorescence detection in tube (FDIT) method. GST-MoMkk1, constitutively unphosphorylated GST-MoMkk1S115A, His-MoAtg1, and Atg1-kinase-dead His-MoAtg1T225A fusion protein were obtained for in vitro phosphorylation analysis. Asterisks denote statistical significances (p < 0.01).
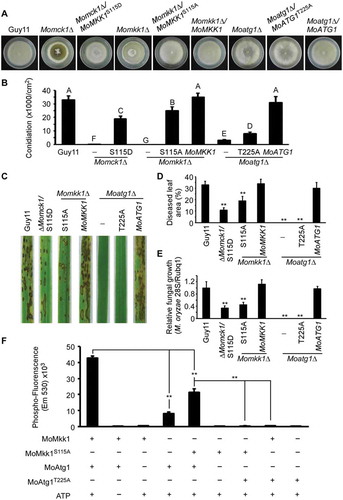
Figure 9. MoAtg1-dependent MoMkk1 phosphorylation is induced during infection of M. oryzae. (A and C) Phosphorylation analysis of MoMkk1. MoMkk1-GFP proteins treated with phosphatase inhibitors were separated by Mn2+-Phos-tag SDS-PAGE and normal SDS-PAGE, respectively, and detected with the GFP antibody. The extent of MoMkk1 phosphorylation was estimated by calculating the amount of phosphorylated-MoMkk1 (P-MoMkk1) compared to the total amount of MoMkk1 (the numbers underneath the blot). (B and D) Detection of the MoMps1 phosphorylation level. The key kinase of the CWI pathway MoMps1 was detected by binding of the P-P44/42 antibody, and the total MoMps1 was detected by the P44/42 antibody as a control. HY, hyphal stage; HY+DTT, hyphae with DTT treatment; Inf, infection stage.
Figure 10. Overexpression of MoATG1, MoATG11, or MoATG17 can enhance the infection of M. oryzae on rice. (A) Pathogenicity analysis of K23 rice using spraying assays. Four milliliters of conidial suspension (5 × 10⁴ spores/ml) of wild-type Guy11 and overexpressing MoATG1, MoATG11, or MoATG17 mutant strains were used for spraying and photographed 7 d after inoculation. (B) Quantification of lesion numbers (per 1.5 cm2) on susceptible rice spayed with conidia of the strains in (A). Error bars represent SD and asterisks represent significant differences (p < 0.01). (C) Diseased leaf area analysis. Data are presented as a bar chart showing percentage of lesion areas analyzed by Image J. Error bars represent SD and asterisks represent significant differences (p < 0.01). (D) Pathogenicity analysis of CO-39 rice using spraying assays. Four milliliters of conidial suspension (5 × 10⁴ spores/ml) of each strain were used for spraying and photographed 7 d after inoculation. (E) Quantification of lesion numbers (per 1.5 cm2) on susceptible rice spayed with conidia of the strains in (D). (F) Diseased leaf area analysis of the leaves in (D).
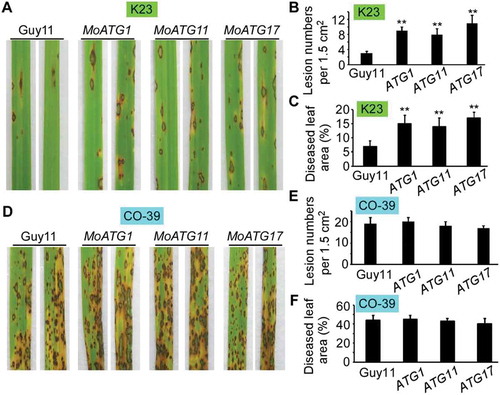
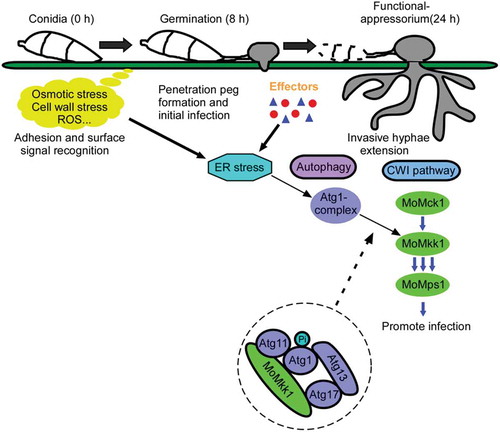
Figure 11. A model of M. oryzae utilizing MoAtg1-dependent MoMkk1 phosphorylation to stimulate the CWI signaling and enhance its infection on rice. During the infection of M. oryzae, it faces various stresses from both external environment and the rice, leading to the fungus synthesis a series of proteins (including several effectors) to resist the adversity. ER stress is then accumulated, accompanied by protein synthesis, to stimulate an essential Atg protein, MoAtg1, and activate MoAtg1-dependent MoMkk1 phosphorylation which finally enhance CWI signaling and promote the infection of the fungus.