Figures & data
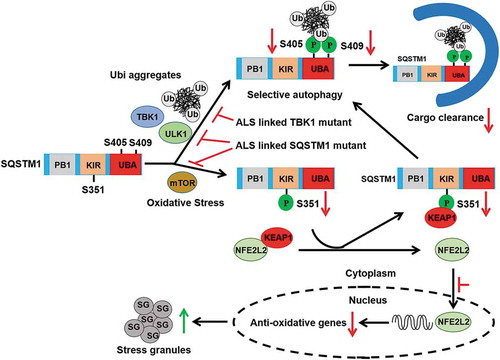
Figure 1. Proteotoxic stresses activate TBK1 activity and ALS-FTLD-linked mutations of TBK1 impair SQSTM1 phosphorylation. (A) WT MEFs were treated with or without MG132 (2 μM) for 16 h to induce proteotoxic stress. Cells were lysed, followed by immunoblot analysis with the indicated antibodies. (B) The ratio of p-TBK1 (Ser172) to total TBK1 in A was shown. One sample t-tests were used, and values are presented as the mean ± SEM (n = 4). ** p < 0.01. (C) HeLa/103QHTT-mCFP inducible stable cells were treated with doxycycline to control the expression of polyQ-mCFP protein. Cells were lysed, followed by immunoblot analysis with the indicated antibodies. GFP antibody was used to indicate the induction of polyQ-mCFP proteins. (D) The ratio of p-TBK1 (Ser172) to total TBK1 proteins in C was shown. One sample t-tests were used, and values are presented as the mean ± SEM (n = 4). ** p < 0.01. (E) NSC34 stable cells including mock, SOD1 WT, and SOD1G93A were lysed, followed by immunoblot analysis with the indicated antibodies. (F) The ratio of p-TBK1 (Ser172) to total TBK1 protein in E was shown. Student t-tests were used, and values are presented as the mean ± SEM (n = 3). ** p < 0.01; ns, not significant. (G) Schematic view of TBK1 protein functional domain. S/T, serine/threonine; Ub-like, ubiquitin like domain; CCD1/2, two C-terminal coiled-coil domains. The positions for ALS-FTLD-linked mutations of TBK1 are indicated. (H) HEK 293T cells were co-transfected with Flag-SQSTM1 and different TBK1 variants. IP was performed with Flag antibody. Immunoblot analysis was done with indicated antibodies. (I) The ratio of p-S409 and p-S405, to total Flag-SQSTM1 in H was shown. One-way ANOVA test was used and followed by Tukey’s post hoc test, and values are presented as the mean ± SEM (n = 3). *** p < 0.001; ns, not significant. (J) Expression of different TBK1 variants in HEK293T cells were examined with the indicated antibodies. (K) The ratio of p-TBK1 (Ser172) to total MYC-TBK1 in J was shown. One-way ANOVA test was used and followed by Tukey’s post hoc test, and values are presented as mean ± SEM (n = 3). *** p < 0.001; ns, not significant.
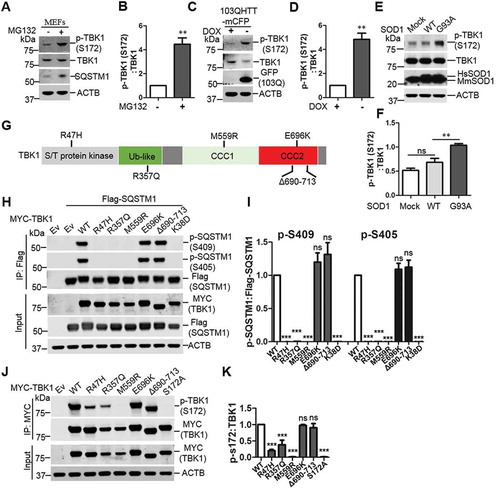
Figure 2. The effects of ULK1 in TBK1 mediated SQSTM1 phosphorylation and ALS-FTLD-linked mutations of SQSTM1 in the phosphorylation of SQSTM1. (A) Phosphorylation assay was performed with purified SQSTM1, TBK1 and ULK1 proteins. The immunoblot analysis was done with the indicated antibodies. (B) MEFs were treated with MG132 (2 μM) and/or SBI-0206965 (2 μM), ULK1 inhibitor. Cells were lysed, followed by immunoblot analysis with the indicated antibodies. (C-D) The ratio of p-SQSTM1 (at Ser405 and Ser409) to total SQSTM1 protein in B was shown. One sample t-tests were used, and values are presented as the mean ± SEM (n = 3). ** p < 0.01, * p < 0.05. (E) Schematic depiction of the sequential phosphorylation of SQSTM1 mediated by ULK1 and TBK1. (F) Schematic view of SQSTM1 protein functional domains. PB1: Phox and Bem1 domain; ZZ: zinc finger motif; TRAF6: TNF receptor associated factor 6; PEST: proline, glutamic acid, serine, and threonine domain; LIR: LC3 interaction region; KIR: KEAP1 interaction region; UBA: ubiquitin association domain. The amino acid number in red indicates the phosphorylation site relevant to this study. The number in black indicates ALS-FTLD linked mutations in the UBA domain. The number is based on the mouse SQSTM1 sequence, and those in brackets indicate the corresponding position in human SQSTM1. (G-J) In vitro phosphorylation assays were performed with ULK1-TBK1 and purified SQSTM1 variants proteins. Immunoblot analysis with the indicated antibodies was followed. The ratio of p-S409 (H) or p-S405 (J) to total SQSTM1 protein was shown. One-way ANOVA test was used and followed by Tukey’s post hoc test, and values are presented as the mean ± SEM (H: n = 5; J: n = 3). * p < 0.05, *** p < 0.001. (K) HEK 293T cells were co-transfected with Flag-SQSTM1 and MYC-ULK1-WT or ULK1-KI. Immunoblot analysis was done with the indicated antibodies. (L-M) The ratio of p-SQSTM1, including p-S409 (L) and p-S405 (M), to total Flag-SQSTM1 protein was shown. One-way ANOVA test was used and followed by Tukey’s post hoc test, and values are presented as the mean ± SEM (n = 3). *** p < 0.001; ns, not significant.
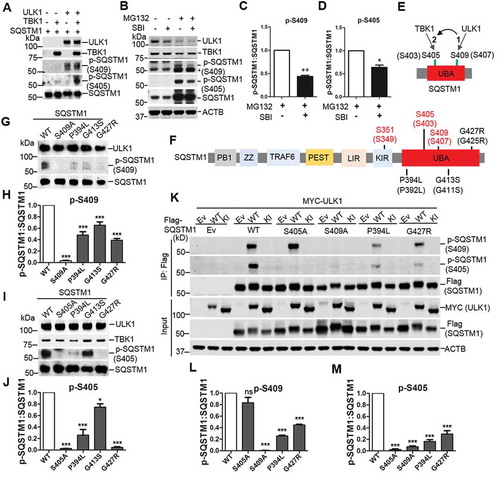
Figure 3. ALS-FTLD-linked mutations of SQSTM1 in the UBA domain affect its binding to ubiquitin and ULK1. (A) MBP and MBP-SQSTM1 variants were subjected to pull down in the presence of K63-linked ubiquitin peptides. Interaction of SQSTM1 variants and Ubs was detected by immunoblot analysis with Ub antibody. (B) Ubiquitin levels pulled down by the MBP-SQSTM1 variants were normalized to protein input and compared to that of MBP-SQSTM1 WT protein. One-way ANOVA test was used and followed by Tukey’s post hoc test, and values are presented as mean ± SEM (n = 6). ** p < 0.01, *** p < 0.001. (C) Cellular lysates of sqstm1 KO MEFs transfected with Flag-SQSTM1 variants were incubated with sqstm1 KO MEFs lysates treated with MG132, followed by IP with anti-Flag antibody. (D) Quantification of the results from C was obtained by normalizing the levels of immunoprecipitated Ub to each Flag-SQSTM1 variant, and then variants were normalized to WT. One-way ANOVA test was used and followed by Tukey’s post hoc test, and values are presented as mean ± SEM (n = 4). *** p < 0.001. (E) Cellular lysates of sqstm1 KO MEFs transfected with Flag-SQSTM1 variants were immunoprecipitated with anti-ULK1 antibody. Immunoblot analysis with the indicated antibodies was followed. (F) Quantification of the results from E was obtained by normalizing levels of immunoprecipitated Flag to the level of input, then further normalized to the level of immunoprecipitated ULK1. One-way ANOVA test was used and followed by Tukey’s post hoc test, and values are presented as the mean ± SEM (n = 3). *** p < 0.001. (G) The SQSTM1P394L and SQSTM1G427R mutations are mapped onto the model structure of the SQSTM1 UBA domain complexed with ubiquitin. The mutated residues are shown as stick models. (H) Binding affinities of SQSTM1 UBA WT or UBAG427R mutant to mono-Ub were measured by ITC. Representative ITC profiles are shown.
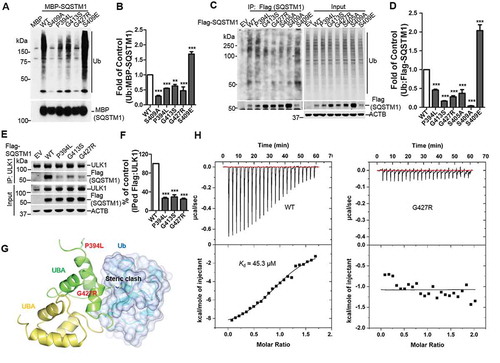
Figure 4. ALS-FTLD mutant SQSTM1G427R of SQSTM1 displays impaired sequestration and clearance of ubiquitinated proteins. (A) MEFs sqstm1 KO stably expressing Flag-SQSTM1 WT or SQSTM1G427R mutant were treated with MG132, followed by immunofluorescent staining with anti-SQSTM1 antibody. Scale bar: 10 μm. (B) Quantification of the results in A was performed by counting the number of cells containing SQSTM1 inclusions. Then, the number of cells containing SQSTM1 inclusions was normalized to the total number of cells. Student t-test was used, and values are presented as the mean ± SEM (n = 3). *** p < 0.001. (C) MEFs sqstm1 KO stably expressing Flag-SQSTM1 WT and SQSTM1G427R mutant were treated with MG132, followed by cell fractionation. Soluble and insoluble fractions were subjected to immunoblot analysis with the indicated antibodies. (D) Quantification of the results in C was performed by normalized the level of insoluble SQSTM1 to the level of soluble SQSTM1. Student’s t-tests were used, and values are presented as the mean ± SEM (n = 4). ** p < 0.01. (E) Flag-SQSTM1 WT and SQSTM1G427R mutant stable cells were treated with MG132 (μM) for 16 h, as indicated, and then the medium was switched to serum starvation (S.S.). (F) Quantification of the results from E was obtained by normalizing the level of polyubiquitinated proteins to the level of ACTB, and further to SQSTM1-WT without S.S. Student-t test was used and values are presented as mean ± SEM (n = 3). * p < 0.05, ns, not significant.
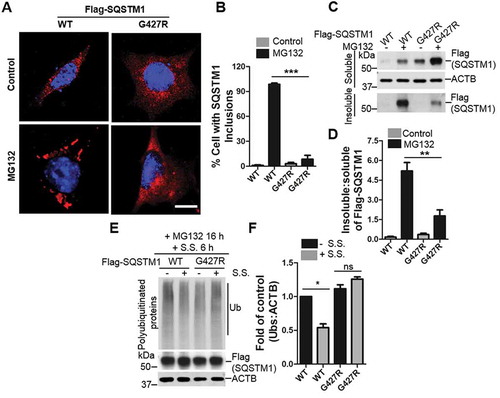
Figure 5. A key role for brain SQSTM1 is the regulation of KEAP1-NFE2L2 pathway that is disrupted by SQSTM1G427R disease mutation. (A) Brain lysates of Sqstm1 WT and sqstm1 KO mice were subject to immunoblot analysis with the indicated antibodies. (B) Quantification analysis of A was shown. Student t-tests were used, and values are presented as mean ± SEM (n = 3 in each genotyping of mice). * p < 0.05, ** p < 0.01; ns, not significant. (C) sqstm1 KO MEFs stably expressing Flag-SQSTM1 WT or SQSTM1G427R mutant were treated with sodium arsenite (10 μM) and then cells were harvested, followed by IP with Flag antibody. An immunoblotting assay was then performed with the indicated antibodies. (D) The ratio of p-SQSTM1 (Ser351) to Flag-SQSTM1 was shown. One sample t-tests were used, and values are presented as the mean ± SEM (n = 3). *** p < 0.001. (E) The results were quantified by normalizing the level of immunoprecipitated KEAP1 to the level of the input and the level of immunoprecipitated Flag. One sample t-tests were used, and the values are presented as the mean ± SEM (n = 3). * p < 0.05. (F) sqstm1 KO MEFs stably expressing Flag-SQSTM1 WT or SQSTM1G427R mutant were treated with sodium arsenite (AS; 10 μM), followed by immunofluorescent staining with anti-SQSTM1 (red) and anti-KEAP1 (green) antibodies and visualizing via fluorescent microscope. Colocalization of SQSTM1 and KEAP1 was illustrated by line profile. Red and green lines indicate SQSTM1 and KEAP1 staining profiles, respectively. Scale bar: 10 μm. (G) sqstm1 KO MEFs stably expressing Flag-SQSTM1 WT and SQSTM1G427R mutant were treated with AS (10 μM), followed by cell fractionation. The soluble and insoluble fractions were subjected to immunoblot analysis with indicated antibodies. (H-I) Quantification of the results in G was performed by normalizing the levels of insoluble SQSTM1 and KEAP1 to the levels of soluble SQSTM1 and KEAP1, respectively. Student t-tests were used, and the values are presented as the mean ± SEM (n = 3). ** p < 0.01, * p < 0.01. (J) sqstm1 KO MEFs stably expressing Flag-SQSTM1 WT or SQSTM1G427R mutant were treated with AS (10 μM) for the indicated times, and then cells were assayed by immunoblotting analysis with the indicated antibodies. (K-L) Quantification of the results from J was obtained by normalizing the level of proteins to ACTB, respectively, and further to the respective control. Two-way ANOVA analysis were used, and values are presented as mean ± SEM (n ≥ 3). *** p < 0.001, ** p < 0.01, * p < 0.05.
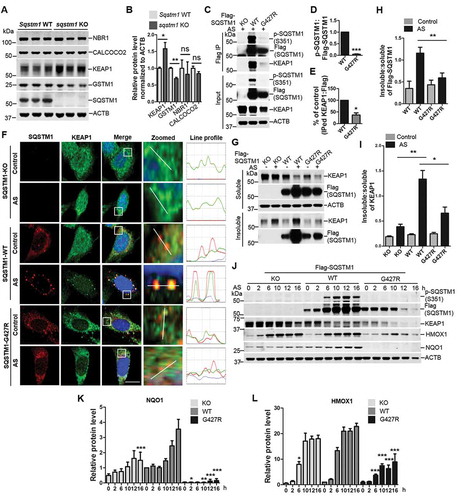
Figure 6. SQSTM1 mutation SQSTM1G427R enhances TARDBP-associated stress granule formation upon oxidative stress. (A) MEFs sqstm1 KO stably expressing Flag-SQSTM1 WT or SQSTM1G427R mutant were treated with AS (10 μM for 6 h), followed by immunofluorescent staining with anti-TARDBP (red) and anti-G3BP1 (green) antibodies and visualizing with fluorescent microscope. Scale bar: 10 μm. Arrows indicate cytosol TARDBP foci co-localized to stress granule marker G3BP1. (B) Quantification of the results in A was performed by counting the number of cells containing TARDBP-positive stress granules as the fraction of the total number of cells. Student t-test was used, and values are presented as the mean ± SEM (n = 3). ** p < 0.01; ns, not significant. (C) MEFs sqstm1 KO stably expressing Flag-SQSTM1 WT or SQSTM1G427R mutant were treated with AS (10 μM for 6 h), followed by cell fractionation. The soluble and insoluble fractions were subjected to immunoblot analysis with the indicated antibodies. (D) Quantification of the results in C was performed by normalizing the level of insoluble TARDBP to the level of soluble TARDBP. Student’s t-tests were used, and values are presented as the mean ± SEM (n = 4). * p < 0.05; ns, not significant.
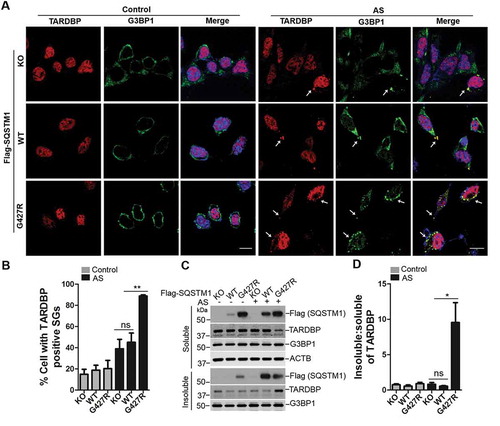
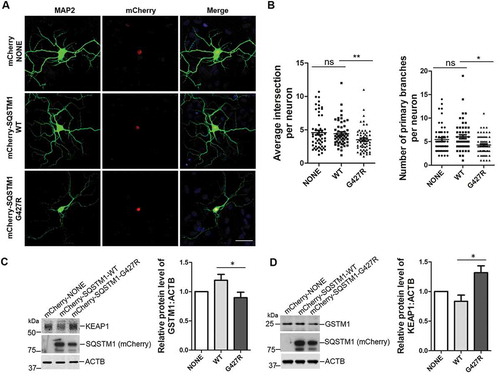
Figure 7. SQSTM1G427R mutation reduces the dendritic complexity and impairs NFE2L2 signaling in neurons. (A) Primary cortical neurons from sqstm1 KO mice at DIV 6 were transfected with mCherry tagged SQSTM1 variants. At DIV 14, neurons were subjected to immunostaining with MAP2. Scale bar: 40 μm. (B) Quantification of the results in A was performed with Sholl analysis comparing the number of primary branches and intersection in transfected neurons. One-way ANOVA analysis were used, and values are presented as the mean ± SEM (mCherry, n = 55; SQSTM1 WT, n = 54; SQSTM1G427R, n = 60 in four transfections). * p < 0.05, ** p < 0.01; ns, not significant. (C-D) Primary cortical neurons from E15-18 embryos of sqstm1 KO mice were infected with AAV viruses carrying indicated SQSTM1 variants. Infected neurons were harvested and subjected to western blot analysis with indicated antibodies. Student t-test was used, and values are presented as the mean ± SEM (n = three infections). * p < 0.05.