Figures & data
Figure 1. Autophagy in the back skin of GFP-LC3 reporter mice. (A) LSM of GFP-LC3 transgenic Atg7f/f and atg7−/–deficient skin samples. Atg7f/f skin displays a discrete number of GFP puncta reminiscent of autophagosomes (→) in all layers of the epidermis (epi). Based on co-immunofluorescence with the epidermal cornification marker IVL (magenta), most of the GFP is found in the transitional layer at the stratum corneum in Atg7f/f and atg7−/- skin. Note that the corneal layer above the transitional layer is negative for GFP. In atg7−/–deficient skin, GFP-LC3 is diffusely distributed, indicative of free GFP-LC3 not incorporated into autophagosomes. In addition, some aggregates are found (►) and both the intensity and thickness of the GFP-positive transitional layer is increased (→←). Below: Quantification of transitional layer thickness, with 0.8 µm Atg7f/f vs. 2.2 µm atg7−/-, p < 0.01, N = 3. Quantification of un-degraded DNA in the corneum, p < 0.05, N = 3. (B) Immunoblot for autophagy and differentiation markers. SQSTM1, at the detection limit with a high variability (11.2 ± 5-fold, p = 0,1); GFP-LC3 levels increased by 2.2-fold in atg7−/- samples due to the abrogation of LC3-I/II conversion (13-fold inhibition). Basal keratin KRT14 (K14) and suprabasal KRT10 (K10) show no alterations. The lysosome marker LAMP1 (2.7-fold, p*<0.05), the intermediate (48 kDa; 1.4-fold, p*<0.05) and the mature (32 kDa) forms of CTSD accumulate in atg7−/- epidermis. The CTSD pro-form is barely detectable. No statistically significant changes are detected in the levels of the terminal keratinization markers FLG (filaggrin) and IVL (involucrin), and RPL26 (ribosomal protein L26). (C) SR-LSM images of the back skin (i) and ear (iii) of Atg7f/f and atg7−/- mice. (i) High abundance of peri-nuclear autophagosomes (open arrowhead) in a basally located cell (α) and the cell above (β). In a higher magnification (ii) the β cell displaying a reticular pattern of GFP-LC3 with one pole of the net being connected to the nucleus (nuclear border is marked by a dotted line). Note: the β cell nucleus is shrunken. (iii) An example of an extremely GFP bright, flattened cell (γ) in the final stage of CDA at the corneum. (iv) Higher magnification images revealing large bubbles of GFP-positive autophagosomes surrounding the hydrolyzed nuclear DNA. (v) Absence of GFP-LC3-positive autophagosomes in atg7−/- cells, showing only occasional spots of aggregated GFP (►). (D) Quantification of keratinocytes undergoing CDA at the SG-SC border in the BS (N = 3). Autophagosomes (→), ACD (open arrowhead), GFP-LC3 aggregates (►). Abbreviations and labels: apical corneal border (dashed line), basal cell (α), basal membrane (fine dashed line), cell moving upward (β), epidermis (epi), fold change relative to KRT10 (fc/K10), IVL (involucrin), GFP-LC3 (green), stratum corneum (SC), stratum granulosum (SG). Nuclear stain: DAPI. Scale bars: 5 µm.
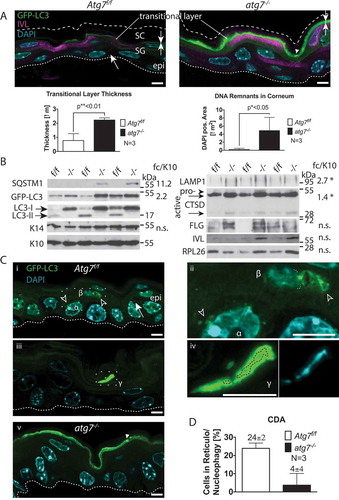
Figure 2. Ultrastructure of the epidermal SG-SC border. (A) Atg7f/f terminal differentiating keratinocytes, with the centrally located ballooning cell being in a transitional state. The nucleus of the cell being large and most of its cytoplasm being lysed. The ER of this cell is well preserved at the left side of the nucleus (rER) but undergoes swelling and fragmentation (ER) at the right side (see also B). Its cytoplasm is mostly clear, for the exception of small vesicles at the upper center of the cell. (B) Higher magnification of the dissolving ER. Partially intact rER with attached ribosomes (*), swollen and fragmented ER (**) and fully dissolved ER (***). Degradation of the ER is seen in a discrete area (encircled by ►), ribosomes (r) are incorporated into vesicles, which are maturing to secondary lysosomes (sLy). (C) High magnification of late-stage reticulophagy in another cell. Ribosomes are incorporation of into ring-like structures, which are interconnected (») to dark secondary lysosomes. (D) Higher magnification of the condensed cell (seen in A) with a deformed, shrunken, and hyperchromatic nucleus. Its outer nuclear membrane (om) is detached at one pole and forms a ballooning perinuclear space (PN), characteristic for CDA (open arrowheads). In the PN, ribosomes and the ER are degraded. Fuzzy heterochromatin (f), a sign for hydrolysis, at the apical nuclear periphery. The cell membrane located towards the corneum is perforated (open →) by sac-like protrusions. Prominent corneodesmosomes (CD) connect the cell to the first layer of flattened corneocytes. (E) Corresponding site in the atg7−/- epidermis with the nucleus of the lower cell being embedded in a cytoplasm full of rER. Ribosomes remain mostly intact until they begin to concentrate at keratohyalin fibers (→, F). The Golgi apparatus (Gg) is prominent and contains very small vesicles (inset). The transitional layer is thickened (→←) with partially degraded cellular material. The nucleus visible in the layer at the left side is condensed and its chromatin appears to have segregated from the main nuclear body. (G) Higher magnification of the transitional layer. Aberrant ribosomal accumulation (→) causing highly electron-dense ribosomal aggregates (⇉) adjacent to areas containing lysosomes (Ly) are visible. (H) Morphometric measurement of accumulating ribosomes (acc., →) 0.8 µm2 Atg7f/f vs. 4.5 µm2 atg7−/-, p < 0.05, ribosomal aggregates (agg., ⇉) 0.1 µm2 Atg7f/f vs. 1.7 µm2 atg7−/-, p < 0.02 and amorphous lysosomal areas (Ly) of the transitional layer 1.4 µm2 Atg7f/f vs. 3.2 µm2 atg7−/-, n.s. Abbreviations and labels: CD, corneodesmosomes; open ►, borders of the PN; closed ►, discrete compartment of ER fragmentation; ER, endoplasmic reticulum; f, fuzzy nuclear periphery; », interconnections between lysosomes; Gg, Golgi apparatus; im, inner nuclear membrane; om, outer nuclear membrane; K, keratohyalin; Ly, lysosomes; M, mitochondria; N, nucleus; open →, perforated plasma membrane; PN, perinuclear space; r, →, ribosomes; rER, rough ER; ⇉, ribosomal aggregates; sLy, secondary Ly; *, **, *** stages of dissolving ER. Scale bars: 1 µm (A, E), 500 nm (B, D, F, G), 100 nm (C).
Figure 3. CDA in sebocytes. (A) Sections of GFP-LC3 transgenic Atg7f/f and atg7−/- mice counterstained with DAPI. In Atg7f/f sebocytes, glandular cells at the border to the sebum contain GFP-LC3 labeled autophagosomes (→). Lipid droplets present in the cytoplasm generate a netlike pattern. (Ai) Higher magnification of one nucleus, which is heavily occupied with autophagosomes (→), some parts of the chromatin are excluded as well as one nucleolus, its DNA appears milky as it is hydrolyzed. (A) Atg7−/- SGs are devoid of GFP-LC3 vesicles but GFP accumulates throughout the cytoplasm, forms aggregates and appears speckled (►). (Aii) Higher magnification of a nucleus, which is highly occupied with GFP. DAPI staining reveals that the nucleus is condensed and hyperchromatic. (B) Sections of an Atg7f/f preputial gland counterstained with Hoechst showing sebocytes undergoing massively and collectively autophagy. Towards the efferent ductal lumen (L), autophagosome formation culminates in disintegrating cells. The cells are in different stages of autophagy induced cell death (I-IIb). Stage I: Cells furthest distant to the ductal lumen display the onset of autophagic vesicles formation. Their nuclei are large and the GFP-LC3 signal is more pronounced close to the nucleus. Stage II: Burst of autophagy in dying cells. Cells are filled with a tremendous amount of autophagosomes and have a slightly condensed nucleus and partially degraded cytoplasm. Stage IIb: Terminal stage. The cytoplasm is mostly cleared, the nucleus is hyper-condensed, decreased numbers of autophagosomes, which are primarily concentrate perinuclear. Abbreviations and labels: ►, accumulation of GFP; →, autophagosomes: h, hair; L, efferent ductal lumen; nu, nucleoli. Scale bars: 5 µm (A), 10 µm (B).
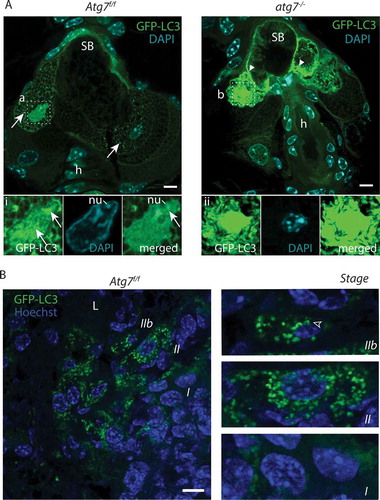
Figure 4. Ultrastructure of the sebaceous gland. (A) Column of differentiating sebocytes in Atg7f/f glands, with lipid droplets (LD) accumulating during differentiation (bottom to top) and dark secondary lysosomes (sLy). (B) Higher magnification of the condensed nucleus of the terminally differentiated cell (in A). The cytoplasm is filled with a darker mass, numerous small primary lysosomes, dark secondary lysosomes (sLy), and lipid droplets (LD). (C) Transitional SGl cells, with sebum (SB) in the upper half. Different stages of cell lysis are visible, with the cytoplasmic membrane being degraded (dashed line indicates a previous cell border) resulting in an open border to the cells below (open→). The lower cells are in a dissolving state, containing lipid droplets (LD) at various stages of fusion and disintegration. The cell at the bottom left contains a dilated, slightly hyperchromatic nucleus (N). (D) Higher magnification of the area (in C) displaying the onset of cell lysis, visible by the LD fusion and break up. In the lower left, the expanded trans-Golgi network of another cell is seen. (E) Column of terminal differentiating sebocytes in a hypertrophic atg7−/- gland. Cells are abundantly filled with LDs and several darkened secondary lysosomes (sLy). In cells bordering the sebum (SB) the nuclei are at different stages of condensation, one being pyknotic (F). The sebum has a more electron-dense and speckled appearance. (F) Higher magnification of the highly condensed and pyknotic nucleus of one of the sebocytes from the gland shown in E. The cytoplasm of this cell is filled with a perinuclear electron-dense material containing an expanded Golgi with numerous primary lysosomal vesicles. (G, H) Cells from a different SGl showing the formation of pathological residual bodies (RB), tertiary lysosomes, which occupies a large area of the cytoplasm. The inside of RB structure has a similar appearance as the sebum seen in the upper ductal part of the image shown in E. (H) At the border and in inner areas of the RB, rER, and ribosomes (→) accumulate, darkening the material. Many primary lysosomes are lined up at the border and are incorporated into the RB (►). Lipid droplets give the RB its speckled appearance. Abbreviations: Gg, Golgi apparatus; LD, lipid droplet; Ly, lysosomes; ►, lysosomes incorporated into the RB; N, nucleus; Nr, nuclear remnant; sLy, secondary lysosomes; RB, residual bodies; rER, rough ER; SB, sebum. Scale bars: 5 µm (A, C, and E), 1 µm (D, G, and H), 500 nm (B and F).
Figure 5. CDA in HaGl cells. (A) Confocal laser scanning microscopy images of HaGl cells. (a) Poly-nucleated Atg7f/f HaGl cell undergoing CDA (encircled), with two different stages of nucleo-phagy occurring. Plenty of autophagosomes are present in the cytoplasm (→) and around the left nucleus. Autophagosomes are degrading and infiltrating the nucleus (open ►). The more central located nucleus (double arrows) is fully eroded within a massive accumulation of autophagosomes (inset). (b) Accumulation of GFP-LC3 in atg7−/- cells. The aggregates here are of spherical and dense appearance and present around a vacuole of the size of a nucleus (white triangle) or form pseudo crystalline structures (*). (B) TEM analysis of ductal HaGl cells. (a) Atg7f/f cells in phase 2 (full CDA). Remnants of a nucleus (Nr), with hyper-condensed chromatin at the upper edge (inset α) and a ballooning perinuclear space filled with hydrolyzed chromatin (c´) and degrading nucleoli (nu) (inset β). The perinuclear space is surrounded by a large number of small vesicles; some are fusing to the perinuclear space (→). The cytoplasm of this cell is mostly degraded and filled with numerous small vesicles. (b) Atg7−/- HaGl cell with multiple aggregates and a centrally located tertiary lysosome = residual body (RB) and many aggregates forming pseudo-crystalline structures (*), which consists of ER stacks (inset). Ribosomes (r) have previously been stripped off and accumulate at the periphery. The RB contains un-degraded material and at its periphery additional stacks of ER. The ER stacks correspond to the pseudo crystalline GFP structures seen above in Ab (*). Abbreviations and labels: →, autophagosomes; c, degraded chromatin; ⇉, full nucleophagy in CDA; LD, lipid droplet; N, nucleus; Nr, nuclear remnant; nu, nucleoli; ►, onset of nucleophagy; RB, open residual body/tertiary lysosome; –, poly-nucleated cell encircled; rER, rough ER; r, ribosomes. Scale bars: 1 µm (A, B).
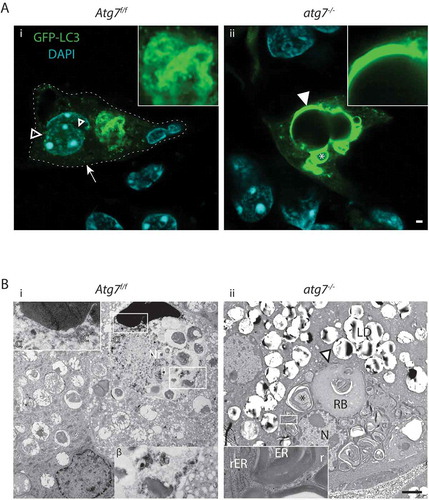
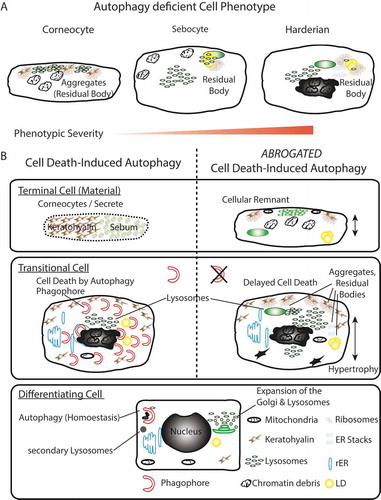
Figure 6. Summary model. (A) Phenotypic homology of terminally differentiated autophagy-deficient keratinocytes, sebocytes, and HaGl cells. In all cell types, the aggregation of ribosomes and accumulation of lysosomes is observed upon ablation of autophagy. In keratinocytes, these aggregates occur at keratohyalin fibres and cause only a very mild phenotype. In the lipid producing SGl and HaGl, additionally, lipids are incorporated into an RB. A unique feature for the HaGl cells are the observed lamellar stacks of smooth ER, which form pseudo-crystalline structures. (B) Model for the dual role of autophagy in cells of the epithelial lineage. On the one hand in basal cells autophagy is required to maintain cell viability by eliminating toxic metabolic by-products. On the other hand, during terminal differentiation when cells have become increasingly resistant to apoptosis, autophagy controls cell death. In this type II cell death (CDA), the trans-Golgi expands and produced an excess of lysosomes. During CDA, autophagosomes target cellular constituents and degrade them by the fusion with lysosomes. Through the perforation of the cell membranes, either a homogenous sebum or flattened corneocytes are generated, respectively, in the glands or the skin. When autophagy is blocked, lysosomes accumulate and together with cellular remnants form aggregates (RB). Ultimately, cell death is delayed and cells remain incompletely degraded.