
Figures & data
Figure 1. SENP3 inhibits the basal and starvation-induced autophagy in mouse livers. Senp3+/- or senp3 cKO mice were fed or fasted for 48 h. n = 3 for each group. (A) The levels of LC3-II in Senp3+/- and control liver tissues were assessed by IB. Quantification of LC3-II:ACTB levels are shown as the mean±SEM of 3 experiments. ** P < 0.01. (B) The dots of LC3 in liver tissues were visualized by immunofluorescence. The representative images are shown (left). Scale bar: 10 μm. LC3 dots number per cell in 20 cells chosen in random were counted and shown as mean±SEM for each group (right). **P < 0.01. (C) The autophagosome (AP) and autolysosome (AL) structures in liver tissues were examined by transmission EM. The representative images are shown (left). A few AL are pointed out with arrows. Scale bar: 500 nm. The numbers of AP + AL per cell in 20 cells chosen in random were counted and shown as mean±SEM for each group (right). **P < 0.01. (D) The levels of LC3-II in senp3 cKO and control liver tissues were assessed by IB. Quantification of LC3-II:ACTB levels are shown as the mean±SEM of 3 experiments. ** P < 0.01, ***P< 0.001. (E) The AP and AL structures in liver tissues were examined by transmission EM. The representative images are shown (left). Some ALs are pointed out with arrows. Scale bar: 1 μm. The numbers of AP + AL per cell in 20 cells chosen in random were counted and shown as mean±SEM for each group (right). ***P < 0.001.
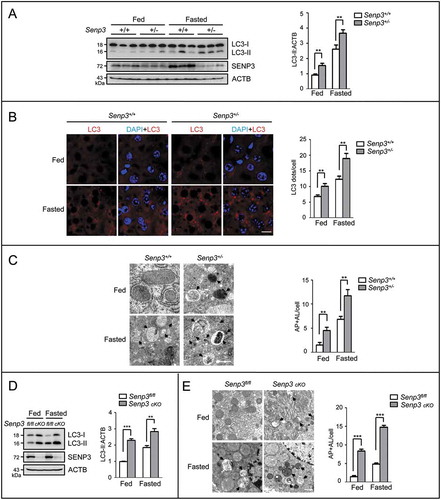
Figure 2. SENP3 inhibits the basal and starvation-induced autophagy in human hepatic and other cell lines. (A, B) The levels of LC3-II and SQSTM1 were assessed by IB in HepG2 cells cultured in EBSS for the indicated times. sh-NC, non-specific shRNA. (A) HepG2 cells with stably knocked down SENP3 (sh-SENP3) or sh-NC were starved in the presence or absence of CQ (10 μM) (upper). HepG2 cells with sh-SENP3 or sh-NC were rescued with mock or Flag-SENP3 under starvation (bottom). Quantifications of LC3-II:ACTB and SQSTM1:ACTB levels are shown as the mean±SEM of 2-3 experiments. *P < 0.05.LE, long exposure; SE, short exposure.(B) HepG2 cells transiently transfected with Flag-tagged WT or mutated SENP3C532A were starved in the presence or absence of CQ (10 μM) (upper). HepG2 cells transiently transfected with Flag-tagged WT or mutated SENP3C532A were starved with EBSS for the indicated times (bottom). Quantifications of LC3-II:ACTB and SQSTM1:ACTB levels are shown as the mean ±SEM of 2 experiments. *P < 0.05, **P < 0.01. (C) The dots of LC3 were visualized by immunofluorescence. HepG2 sh-SENP3 or sh-NC cells were starved with EBSS for 1 h. The representative images are shown (left). Scale bar: 10 μm. LC3 dots number per cell in 30 cells chosen in random were counted and shown as mean±SEM (right). **P < 0.01. (D) The AP and AL structures were examined by transmission EM. HepG2 sh-SENP3 or sh-NC cells were starved with EBSS for 1 h. The representative images are shown (left). Some ALs are pointed out with arrows. Scale bar: 500 nm. The numbers of AP + AL per cell in 20 cells chosen in random were counted and shown as mean±SEM (right). *P < 0.05, **P < 0.01. (E) The levels of LC3-II or SQSTM1/p62 were assessed by IB. Liver carcinoma cell line SMMC-7721 and immortalized non-cancer hepatocytes LO2 with stably knocked down SENP3 or sh-NC were starved with EBSS for the indicated times in the presence or absence of CQ (10 μM). Quantifications of LC3-II:ACTB and SQSTM1:ACTB levels are shown as the mean ±SEM of 2-3 experiments. *P < 0.05, **P < 0.01. (F, G) The levels of LC3-II in the presence or absence of CQ (10 μM) and the levels of SQSTM1/p62 were assessed by IB in various cell lines. GFP-SENP3 was overexpressed in MCF-7 and Hep-2 cells. SENP3 was stably knocked down in HeLa and HCT116 cells. Quantifications of LC3-II:ACTB and SQSTM1:ACTB levels are shown as the mean±SEM of 2-3 experiments. *P < 0.05.
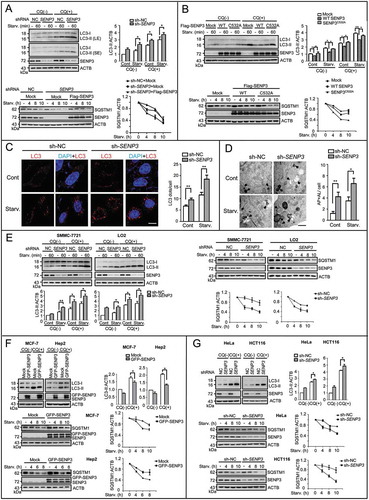
Figure 3. SENP3 impairs the activity of PIK3C3 and the formation of BECN1-PIK3C3 complex. (A) The levels of phos-EIF4EBP1 and phos-RPS6KB1 were assessed by IB. HepG2 cells transiently transfected with mock DNA or GFP-SENP3 were starved with EBSS for the indicated times.Quantifications of phos-EIF4EBP1:EIF4EBP1 (left) and phos-RPS6KB1:RPS6KB1 (right) levels are shown. (B) The PIK3C3 activity was determined by RFP-FYVE dots. HepG2 sh-SENP3 or sh-NC cells were transfected with RFP-FYVE and starved with EBSS for 1 h. The representative images are shown (left). Scale bar: 10 μm. RFP-FYVE dots number per cell in 30 cells chosen in random were counted and shown as mean±SEM (right), *P < 0.05, **P < 0.01. (C) HepG2 sh-SENP3 or sh-NC cells were transfected with Flag-BECN1 for 48 h and starved with EBSS for the indicated times. The interaction of BECN1 with the PIK3C3 complex components was assessed by Flag-IP assay. (D) HepG2 sh-SENP3 or sh-NC cells were transfected with Flag-tagged UVRAG for 48 h and starved with EBSS for the indicated times. The interaction of UVRAG with the PIK3C3 complex components was assessed by Flag-IP assay. (E) The endogenous interaction of BECN1 with the complex components was analyzed by co-IP assay in liver tissues. Liver tissues were derived from Senp3-intact and senp3 cKO mice fed or fasted for 48 h. Liver tissue lysates were immunoprecipitated with anti-BECN1 or anti-UVRAG antibodies respectively.
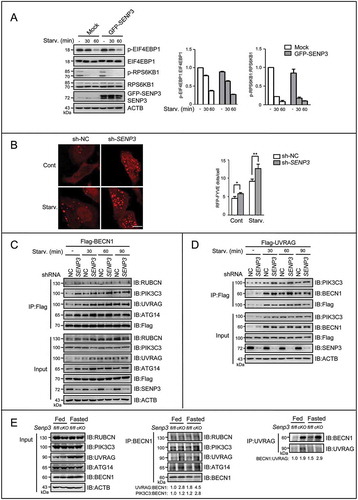
Figure 4. BECN1 is subject to the reversible SUMOylation catalyzed by PIAS3 and SENP3. (A-C, E, F and H) The SUMO3 conjugates of BECN1 in HEK293T cells were assessed by Ni-NTA affinity-isolation assay. (A) Cells were transfected with Flag-BECN1 and an increasing dose of RH-SUMO3 for 48 h. (B) Cells were transfected with Flag-BECN1and RH-SUMO3 in the presence or absence of Flag-UBE2I for 48 h. (C) Cells were transfected with Flag-BECN1, RH-SUMO3 and an increasing dose of HA-PIAS3 for 48 h (left). Cells were transiently transfected with si-PIAS3 or si-control for 24 h, and then transfected with Flag-BECN1 and RH-SUMO3 for another 48 h (right). (D) The exogenous or endogenous interaction of PIAS3 and BECN1 was assessed by Flag-IP and co-IP assays. HEK293T cells were transfected with Flag-BECN1 and HA-PIAS3 for 48 h (upper). HepG2 cell lysates were immunoprecipitated with anti-BECN1 and assessed by IB with the indicated antibodies (bottom). (E) Cells were transfected with Flag-BECN1, RH-SUMO3 and an increasing dose of GFP-SENP3 for 48 h (left). Cells were transfected with Flag-BECN1, RH-SUMO3 and GFP-tagged WT SENP3 or mutated SENP3 (C532A) for 48 h (right). (F) Cells were transfected with Flag-BECN1, Flag-UBE2I, RH-SUMO3, HA-PIAS3 and GFP-SENP3 for 48 h. Cell lysates were assessed by IB with a condensed gel. Curly brace indicated conjugated SUMO3. (G) The exogenous or endogenous interaction of BECN1 and SENP3 was assessed by Flag-IP and co-IP assays. HEK293T cells were transfected with Flag-BECN1and GFP-SENP3 for 48 h (upper). HepG2 cell lysates were immunoprecipitated with anti-BECN1and assessed by IB with the indicated antibodies (bottom). (H) Cells were transfected with RH-SUMO3, Flag-tagged WT or mutated BECN1 (K26R and K380R individually).
Figure 5. SUMOylation/deSUMOylation of BECN1 modulates complex formation and PIK3C3 activity to affect autophagic flux. (A) The levels of LC3-II and SQSTM1 were assessed by IB in HepG2 cells starved with EBSS for the indicated times. Before starvation, cells were transfected with si-BECN1 (3-untranslated region, 3’UTR) for 24 h, and then added back with Flag-tagged WT, SUMOless mutant BECN1(K380R) respectively for another 48 h in the presence or absence of CQ (10 μM). Quantifications of LC3-II:ACTB and SQSTM1:ACTB levels are shown as the mean ±SEM of 2-3 experiments. *P < 0.05. (B) The mCherry-LC3 dots were measured. BECN1-silenced HepG2 cells were added back with GFP-tagged WT or mutant BECN1 (K380R) and co-transfected with mCherry-LC3 for 48 h. Cells were starved with EBSS for 1 h. The representative images are shown (left). Scale bar: 10 μm. mCherry-LC3 dots number in both mCherry-LC3 and GFP-BECN1 positive cells (n = 20) chosen in random were counted and shown as mean±SEM (right), *P < 0.05, **P < 0.01. (C) The PIK3C3 activity was assessed by RFP-FYVE dots. BECN1-silenced HepG2 cells were added back with GFP-tagged WT BECN1 or mutant BECN1K380R and co-transfected with RFP-FYVE for 48 h. Cells were starved with EBSS for 1 h. The representative images are shown (left). Scale bar: 10 μm. RFP-FYVE dots number in both RFP-FYVE and GFP-BECN1 WT or GFP-BECN1K380R-positive cells (n = 50) chosen in random were counted and shown as mean±SEM (right), ***P < 0.001. (D) The interaction between BECN1 and its binding partners in the BECN1-PIK3C3 complex was assessed by Flag-IP assay. BECN1-silenced HepG2 cells were added back with Flag-tagged WT BECN1 or SUMOless mutant BECN1K380R for 48 h respectively.
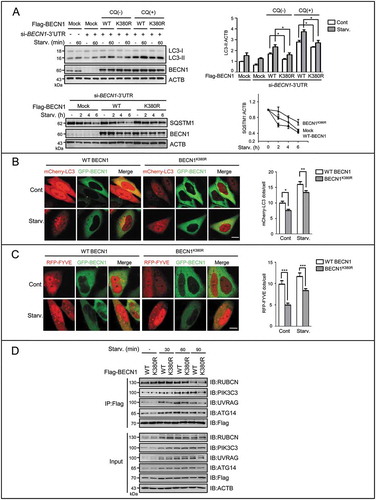
Figure 6. SENP3 accumulates in the cytoplasm and increases its interaction with BECN1 to enhance deSUMOylation upon starvation. (A) The expression levels of SENP family were assessed by IB. HepG2 cells were starved with EBSS for the indicated times. (B) The level of H2O2 was detected by HyPer-3 biosensor. HepG2 cells transiently transfected with HyPer-3 biosensor was starved with EBSS for the indicated times. Live-cell imaging of HyPer-3 biosensor was performed within the indicated times. Representative pseudo-color images are shown (left). Purple represented the lowest 488:405 nm ratio, and the red represented the highest ratio. Scale bar: 50 μm. The ROS change over time in the representative cell is shown (right). (C) The level of SENP3 was assessed by IB. HepG2 cells were starved with EBSS for the indicated times in the presence or absence of 10 mM NAC preincubation for 12 h. Quantifications of SENP3:ACTB levels are shown as the mean±SEM of 2 experiments. *P < 0.05, ***P < 0.001. (D) The levels of nuclear (Nu) and cytoplasmic (Cyto) fractions of SENP3 were assessed by IB. HepG2 cells starved with EBSS for the indicated time. PARP1 and TUBA were taken as the internal controls for nucleus and cytoplasm. (E) The cytoplasmic level of endogenous SENP3 was visualized by immunofluorescence following a modest permeabilization. HepG2 cells were starved with EBSS for the indicated times. Scale bar: 5 μm. (F) The interaction of BECN1 with endogenous SENP3 or PIAS3 was determined by FRET analysis in HepG2 cells transfected with GFP-tagged BECN1 starved with EBSS for the indicated times after SENP3 or PIAS3 immunofluorescence. Scale bar: 10 μm. N-FRET values in 10 cells are shown. **P < 0.01, ***P < 0.001. (G) The dynamic interaction of PIAS3 or SENP3 and BECN1 was assessed by Flag-IP assay. HepG2 cells transfected with Flag-BECN1 were starved with EBSS for the indicated times. (H) The endogenous SUMO2/3 conjugates of BECN1 were assessed by co-IP assay in liver tissues derived from Senp3-intact and -cKO mice fed or fasted for 48 h. Liver tissue lysates (identical to those used for the co-IP in Figure 3(E)) were immunoprecipitated with anti-BECN1 and assessed by IB with the indicated antibodies.
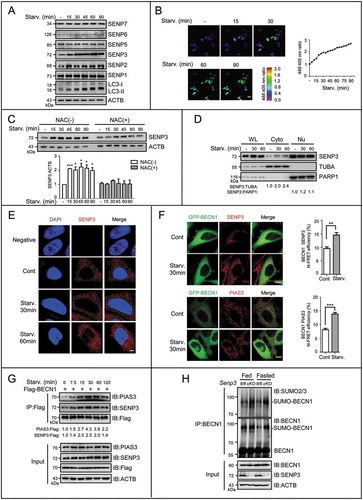
Figure 7. A working model for BECN1 SUMOylation and deSUMOylation and role of SENP3 in fine-tuning autophagy. BECN1 undergoes reversible SUMOylation during autophagy, which is catalyzed by SUMO E3 ligase PIAS3 and SUMO2/3 protease SENP3 respectively. Under starvation stress condition, BECN1 SUMOylation is increased, which is important for BECN1 interaction with UVRAG, ATG14, PIK3C3 and the activation of PIK3C3, and thus the autophagosome formation. Meanwhile, starvation can lead to the increase of ROS and the ROS-dependent accumulation of SENP3, which weakens the BECN1 SUMOylation to some extent. This strengthens its role as a brake upon the occurrence of starvation stress to avoid excess autophagy. Dashed lines indicate other regulation on autophagosome formation downstream of starvation and ROS.
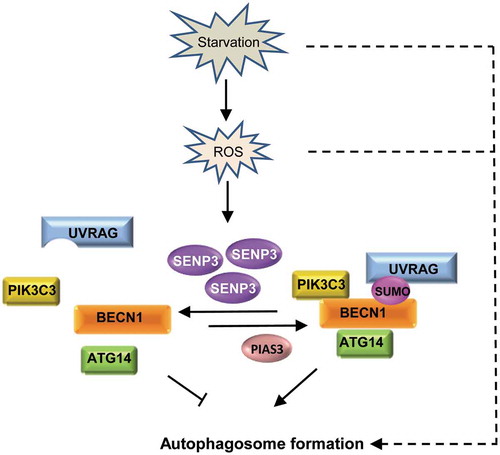
Table 1. The primers and siRNA/shRNA sequences used in this study.