
Figures & data
Figure 1. Determination of antigen-presenting potential of synovial fibroblasts (SFs) and B cells. SFs and B cells were left untreated or treated with 100 ng/mL IFNG for 72 h. Cell surface expression of human leukocyte antigen (HLA)-DR and that of B7 costimulatory molecules were analyzed by flow cytometry. Histograms are representative of 3 independent experiments using cells from 3 different patients (A). Cell surface expression levels of the molecules were quantified and presented as mean fluorescent intensity (MFI) compared to isotype controls (B). SFs were left untreated or treated with 100 ng/mL IL6 plus soluble IL6RA/IL-6R for 72 h. Cell surface expression of HLA-DR and that of B7 costimulatory molecules were analyzed by flow cytometry. Histograms are representative of 3 independent experiments using cells from 3 different patients (C). MFI of C (D). Values are presented as mean ± S.D. * = P < 0.05.
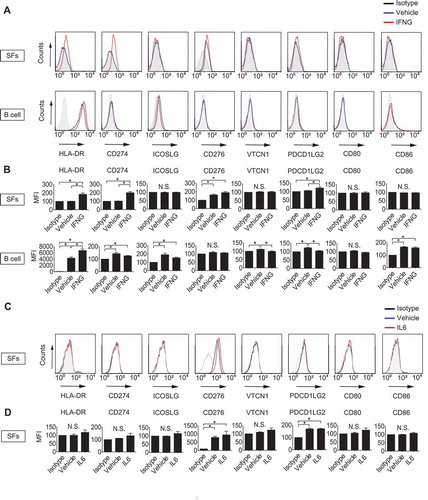
Figure 2. Detection of intracellular citrullinated antigens in synovial fibroblasts (SFs). Recombinant human VIM (rVIM) and SF lysates were immunoblotted using anti-citrullinated peptide antibodies (ACPA) positive or negative rheumatoid arthritis patient’s serum or anti-VIM, -citrulline or -citrullinated VIM (cVIM) antibody as a primary antibody (A). SF lysates were immunoprecipitated with anti-VIM antibody or normal goat IgG and blotted with anti-VIM, -citrulline or -cVIM antibody (B). IP, immunoprecipitation.
Figure 3. Effects of autophagy induction by serum-free starvation on citrullination of intracellular VIM in synovial fibroblasts (SFs). Rheumatoid arthritis (RA) and osteoarthritis (OA) SFs were normally cultured or incubated in serum-free medium for the indicated times and their lysates were immunoblotted. Blots are representative of 4 independent experiments, respectively (A and C). Densitometric analysis of A and C. Autophagy activity and citrullinated VIM (cVIM) were evaluated by LC3-II:ACTB/β-actin and cVIM:ACTB ratio, respectively (B and D). RASFs and OASFs were normally cultured or incubated in serum medium for 2 h in the presence or absence of 5 mM 3-methyladenine (3-MA), an autophagy inhibitor, and their lysates were immunoblotted. Blots are representative of 4 independent experiments (E and G). Densitometric analysis of E and G (F and H). Values are presented as mean ± S.D. * = P < 0.05.
Figure 4. Immunocytochemical analysis of the co-expression of human leukocyte antigen (HLA)-DR-citrullinated VIM (cVIM) in synovial fibroblasts (SFs). cVIM (green), HLA-DR (red) were visualized and nuclei were stained with DAPI (blue). RASFs and OASFs were left untreated (control) or treated with 100 ng/mL IFNG for 72 h followed by serum-free starvation in the last 2 h (starvation + IFNG). Scale bar: 50 μm.
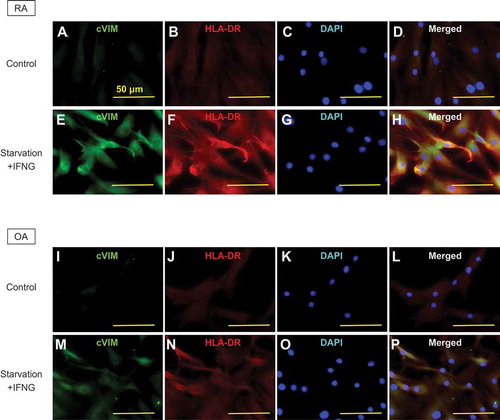
Figure 5. Interaction between HLA-DR and citrullinated VIM (cVIM) in synovial fibroblasts (SFs). RASFs were treated with IFNG for 72 h followed by serum-free starvation in the last 2 h and their lysates were co-immunoprecipitated with anti-HLA-DR antibodies and blotted with anti-HLA-DR or -cVIM antibodies (A). Proximity ligation assay to demonstrate the formation of HLA-DR-cVIM complexes. RA and OA SFs were left untreated, starved in serum-free medium, or treated with IFNG in the presence or absence of 3-MA. Figures are representative images of 3 independent experiments using cells from 3 different patients (C). Scale bar: 50 μm. Representative cell of Civ (B). Scale bar: 100 μm. Quantification of HLA-DR-cVIM PLA complexes in RASFs (D). Values are presented as mean PLA signal per cell ± S.D. * = P < 0.05. Comparison the quantification of HLA-DR-cVIM PLA complexes in RASFs and OASFs (E). Values are presented as mean PLA signal per cell ± S.D * = P < 0.05.
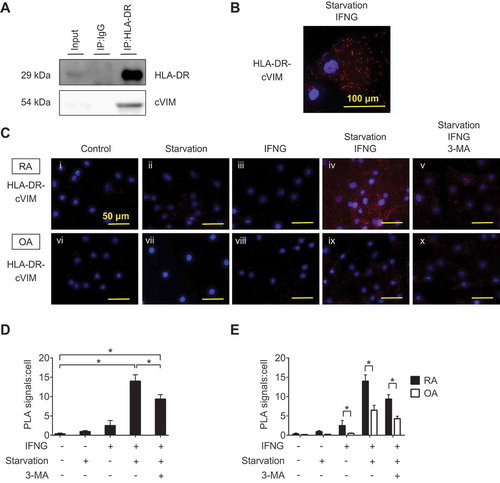
Table 1. Primers used in this study.