Figures & data
Table 1. Transgenic mouse model systems for in vivo assessment of autophagy activity.
Figure 1. In vivo autophagosome flux imaging. In vivo imaging and acquisition of fluorescent signal using light sheet microscopy enables autophagic flux visualization in the living whole organism, identifying regions of high, intermediate and low flux. Flux may be indicated as ratiometric signal, or, if resolution is sufficient, as autophagy pathway intermediates, upon the complete inhibition of autophagosome lysosome fusion using bafilomycin A1 (Baf).
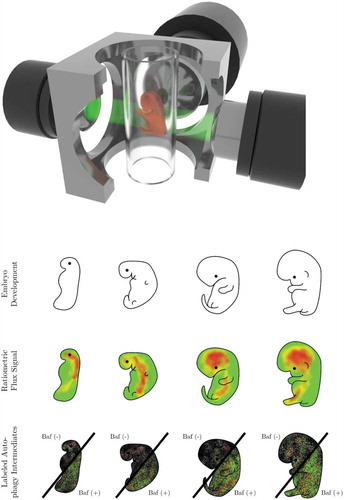
Figure 2. Revealing the presence of a steady state autophagy flux and kinetics of flux changes in vivo. Autophagosome flux measures can be used to quantify and visualize the organ-specific transition time, i.e. the time required for an organ to clear its complete autophagosomal pool (nA). Note, the change in autophagosome number (indicated by the slope) describes the autophagosome flux (J) in autophagosomes/cell/h.
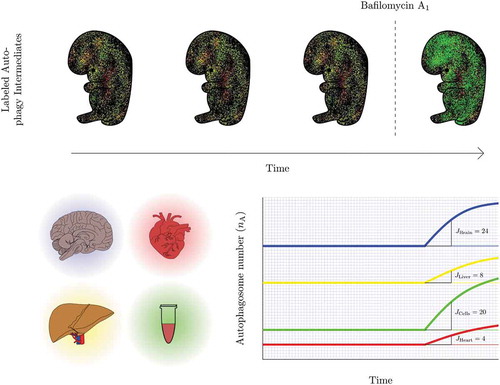
Table 2. Desirable conditions for measuring autophagy flux in vivo and using light sheet microscopy specifically [Citation52–Citation55].
Figure 3. Measuring autophagy induction. (A) How high is high enough? Many autophagy inducers exist and may be drug-, diet- or lifestyle-derived, incrementally (Jinduced1 and Jinduced2) inducing autophagy above baseline levels (Jbasal) upon repeated exposure. Plotting this sequential enhancement of autophagosome flux may indicate the maximal achievable autophagosome flux for the cellular system and the flux that is most favorable for a given therapeutic intervention. (B) How good is the inducer? A most sensitive assessment of autophagy inducers is required that allows concentration-dependent titration of autophagosome flux and selection of the most suitable concentration to achieve a desirable flux induction above reduced or pathological autophagy activity. (C) Matching drug concentration with flux response. What drug concentration is required to achieve, for example, a 10% increase in autophagosome flux? The cartoon is depicting 3 distinct autophagy inducers and the concentration that leads to a 25, 50 and 75% increase in autophagosome flux.
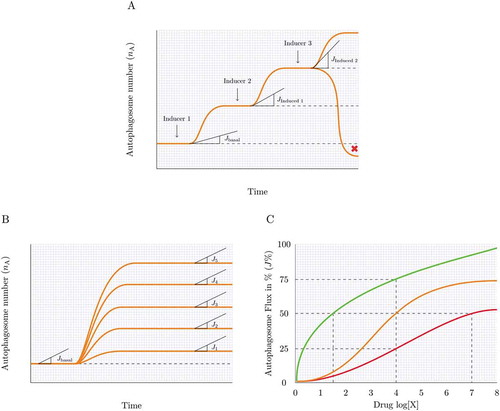
Figure 4. Assessing the steady state. Knowing whether the autophagy system is at steady state (A), reaches a new steady state (B), becomes unstable or in transition (C) or maintains a heightened flux for a given time (D) can be achieved by plotting the autophagosome pool under defined interventions. Likewise, a cellular system may be non-responsive to an autophagy induction, despite having a basal steady state flux or may be responding robustly to an autophagy inducer without establishing a new steady state and steady state flux. Note, the change in autophagosome number (indicated by the slope) describes the autophagosome flux (J) in autophagosomes/cell/h.
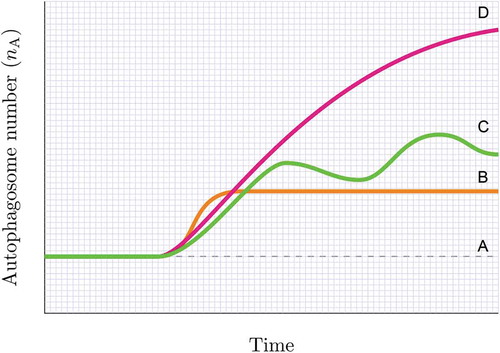
Figure 5. Autophagy response dynamics. (A) Tuning autophagosome flux with minimal side effects. A physiological autophagic activity exists (green) that homeostatically tunes cellular metabolism with autophagic activity. However, autophagic flux can be drug-induced or inherently pathologically altered, leading to the manifestation of side effects (e.g. thrombocytopenia in chloroquine treatment). The percent autophagosome flux plotted against the clinical side effect of interest allows the tuning of autophagic flux with desired parameters of health. (B) Dosing and scheduling. Autophagosome flux is tissue specific. Plotting autophagosome flux in PBMCs together with the flux of the tissue of interest (e.g. tumor biopsies) as well as the plasma concentration of the autophagy-modulating drug present at that time, may reveal the desirable autophagy response that is required in the target tissue of interest. PBMCs may serve as a suitable autophagic flux reference, due to their relative accessibility. (C) Dosing and scheduling. Assessing autophagy response dynamics: The change of the total autophagosome pool in the target organ reveals the time when steady state is reached (t1) and lost, and whether flux is sufficiently (green shaded area) lifted above dysfunctional (red shaded area) levels. Shown here is a single application of 4 different autophagy inducers.
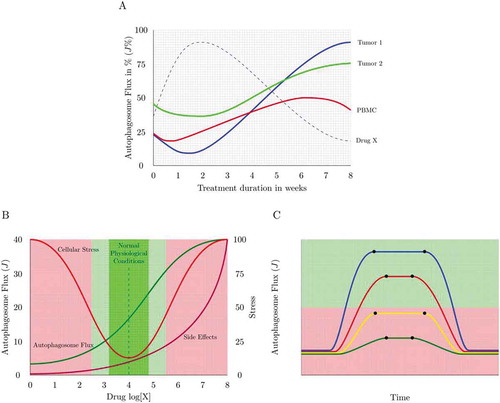
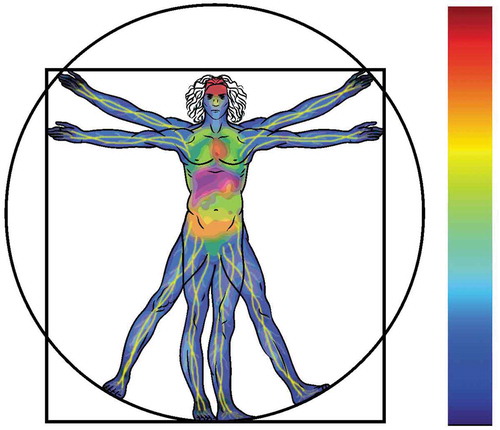
Figure 6. Tissue-specific autophagic activity distribution imagined: a systemic human autophagy flux distribution profile, describing regions of high (red), intermediate (yellow) and low (blue) autophagy flux.