Figures & data
Figure 1. Autophagy and mitophagy were downregulated in brains of high salt-fed SHRSP. (A-C) Representative western blots for LC3 and SQSTM1 and corresponding densitometric analyses in SHRSP and SHRSR fed with either regular diet (RD) or high salt Japanese style diet (JD) for 4 weeks (n = 6 for each group). (D-E) Autophagic flux in SHRSP fed with either RD or JD for 4 weeks. At the end of treatment, a single administration of chloroquine (Chl) was performed; a representative western blot for LC3 is shown (n = 3). (F-H) Analysis of mitophagy in SHRSP fed with either RD or JD for 4 weeks (n = 6 for each group); a representative western blot for COX4I1 with densitometric analysis (F-G) and mitochondrial DNA content (H) are shown (n = 6). Results are presented as mean values ± SEM; *p < 0.05 **p < 0.01 for the indicated comparisons.
Figure 2. Nicotinamide mononucleotide (NMN) reactivated autophagy in Ndufc2-silenced A10 cells. (A-C) Representative western blots of LC3 and SQSTM1 with densitometric analyses in Ndufc2-silenced (siRNA) A10 cells treated with sodium chloride (NaCl) (n = 4). (D) NAD+:NADH ratio in cells with Ndufc2 silencing, treated or not with NMN (n = 3–7). (E-F) Representative western blot of LC3 and corresponding densitometric analysis in Ndufc2-depleted A10 cells treated with NaCl and exposed to NMN (n = 3). (G-H) Representative western blot of COX4I1 and corresponding densitometric analysis in Ndufc2-depleted A10 cells treated with NaCl and exposed to NMN (n = 3). (I) Mitochondrial DNA content (mtDNA) in Ndufc2-silenced cells exposed to NaCl and treated with NMN (n = 4). CTR indicates non-silenced and untreated cells. Results are presented as mean values ± SEM; *p < 0.05 **p < 0.01 ***p < 0.001 for the indicated comparisons.
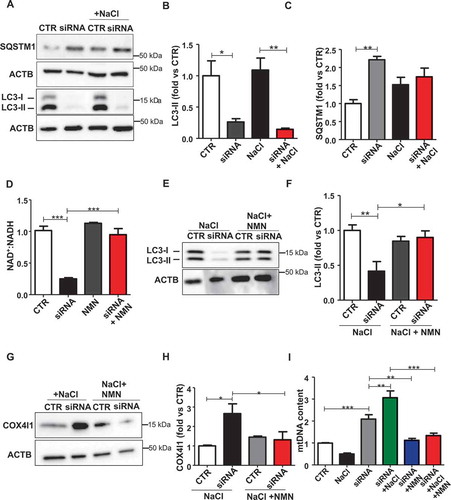
Figure 3. NMN improved mitochondrial function and cell viability in vitro. (A) Evaluation of ultrastructural damage in mitochondria from A10 cells with Ndufc2 knockdown; representative micrographs of mitochondria (left) and graphical representation of the ultrastructural damage in either untreated or treated A10 cells (n = 3). Legend: Nu, nucleus; NM, nuclear membrane, PM, plasma membrane; rER, rough endoplasmic reticulum; Gx, grade of mitochondrial (Mt) damage; IMM, inner mitochondrial membrane; OMM, outer mitochondrial membrane. (B) Fluorescence microscope analysis of mitochondrial membrane potential (ΔΨm) levels through JC1 dye (n = 3); representative images (left) and corresponding quantification (right) are shown. (C) FACS analysis in A10 cells with Ndufc2 knockdown treated with NaCl without or with NMN (n = 3); CTR indicates non-silenced and untreated cells. Results are presented as mean values ± SEM; *p < 0.05 **p < 0.01 ***p < 0.001; ns, not significant for the indicated comparisons.
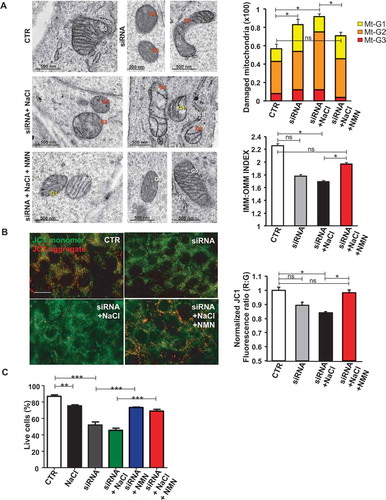
Figure 4. Restoration of NAD+:NADH through NMN increased stroke-free survival in JD-fed SHRSP and reactivated autophagy. (A) NAD+:NADH ratio in brains of SHRSP fed with RD, JD and JD plus NMN (n = 3 for each group). (B) Stroke occurrence in JD-fed SHRSP with (n = 6) or without (n = 6) NMN; the comparison was significant p < 0.001. (C-D) Representative western blot of LC3 and corresponding densitometric analysis in SHRSP fed for three weeks with RD, JD and JD plus NMN (n = 5 for each group). (E-F) Representative western blot of COX4I1 and corresponding densitometric analysis in brains of SHRSP fed for three weeks with RD, JD, JD plus NMN (n = 3 for each group). (G) mtDNA content in brains of SHRSP fed for three weeks with RD (n = 3), JD (n = 4), JD plus NMN (n = 3). (H) Mitochondrial ATP levels in brains of SHRSP fed for 3 weeks with RD, JD and JD plus NMN (n = 3 for each group). Results are presented as mean values ± SEM; *p < 0.05 **p < 0.01 ***p < 0.001 for the indicated comparisons.
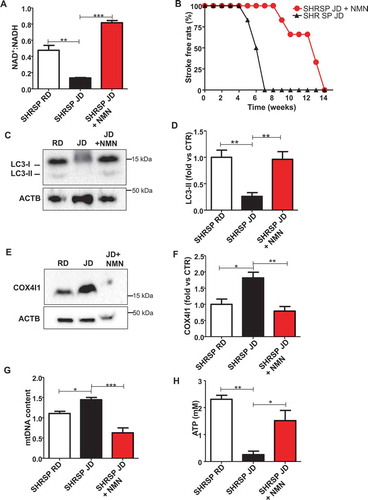
Figure 5. Reactivation of autophagy and mitophagy through Tat-Beclin 1 decreased stroke occurrence and renal damage in JD-fed SHRSP. (A) Stroke occurrence in JD-fed SHRSP with (n = 6) or without (n = 6) Tat-Beclin 1 (TAT-BEC); the comparison was significant, p < 0.001. (B) Proteinuria levels in JD-fed SHRSP without or with TAT-BEC. (C-D) Representative western blot of LC3 and corresponding densitometric analysis in brains of SHRSP fed for three weeks with RD, JD, JD plus Tat-Beclin 1 (TAT-BEC) (n = 4). (E-F) Representative western blot of COX4I1 and corresponding densitometric analysis in brains of SHRSP fed for three weeks with RD, JD, JD plus Tat-Beclin 1 (n = 4). (G) Mitochondrial DNA content in brains of SHRSP fed for three weeks with RD (n = 4), JD (n = 6), JD plus Tat-Beclin 1 (n = 4). Results are presented as mean values ± SEM; *p < 0.05 **p < 0.01 ***p < 0.001 for the indicated comparisons.
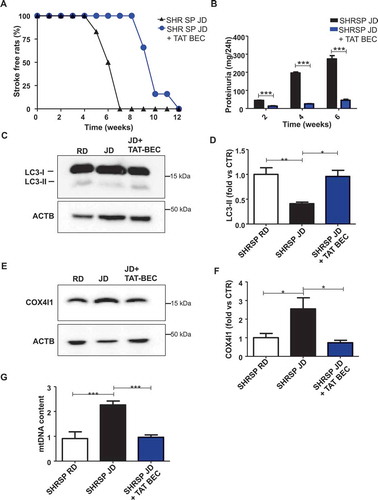
Figure 6. Tat-Beclin 1 rescued mitochondrial ultrastructural damage and function in brains of JD-fed SHRSP. (A) Evaluation of ultrastructural damage in mitochondria from SHRSP brain tissue; representative micrographs of mitochondria (left) and graphical representation of the ultrastructural damage (n = 4 for each group). Legend: Gx, grade of mitochondrial (Mt) damage; IMM, inner mitochondrial membrane; OMM, outer mitochondrial membrane. Student T test: *p < 0.05 **p < 0.01; ns, not significant. (B-C) Evaluation of mitochondrial function in brains of SHRSP fed with RD (n = 4), JD (n = 6) and JD plus Tat-Beclin 1 (n = 4) (TAT-BEC): complex IV activity (B) and mitochondrial ATP levels (C). Results are presented as mean values ± SEM; *p < 0.05 **p < 0.01 for the indicated comparisons.
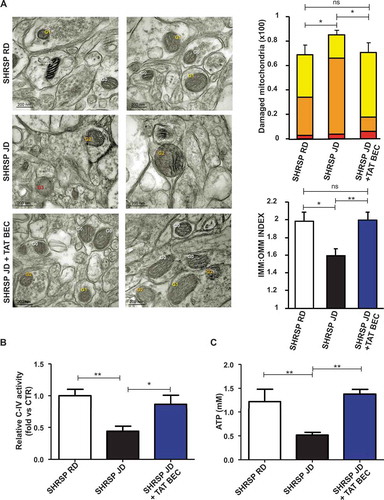
Figure 7. Reactivation of autophagy increased cell survival in primary SHRSP cerebral ECs. (A-B) Representative western blot of NDUFC2 with corresponding densitometric analysis in ECs isolated from SHRSP exposed to NaCl is shown (n = 3). (C-D) Representative western blot of LC3 with corresponding densitometric analysis in ECs isolated from SHRSP exposed to NaCl either in the absence or in the presence of Tat-Beclin 1 (TAT-BEC) pre-treatment for 5 h (n = 3). (E) Cell survival in ECs isolated from SHRSP exposed to NaCl, either in the absence or in the presence of TAT-BEC pre-treatment for 5 h. CTR indicates untreated cells. Results are presented as mean values ± SEM; *p < 0.05, **p < 0.01 for the indicated comparisons.
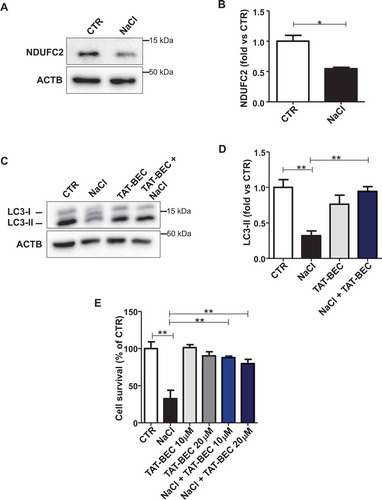
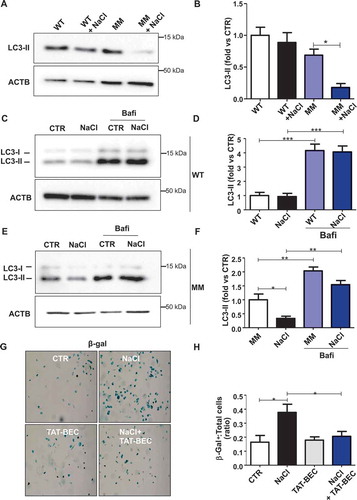
Figure 8. Autophagy was downregulated in endothelial progenitor cells (EPCs) derived from human subjects carrying the rs11237379/NDUFC2 variant. (A-B) Representative western blots and corresponding densitometric analyses of LC3 in EPCs exposed to 20 mM sodium chloride (NaCl) for 72 h (n = 5). (C-F) Evaluation of autophagic flux in EPCs treated with NaCl and exposed to bafilomycin A1 (bafi) for the last 4 h of the treatment. Representative western blot and corresponding densitometric analyses of LC3 in EPCs of WT subjects are shown (C-D, n = 3). Representative western blot and corresponding densitometric analyses of LC3 in EPCs of MM subjects are also shown (E-F, n = 3). (G-H) Cell senescence experiments: representative images of β- galactosidase (β- gal)-positive EPCs of MM subjects exposed for 72 h to 20 mM NaCl either in the presence or in the absence of 1 µM Tat-Beclin 1 (G, TAT-BEC). Corresponding quantification of β-gal-positive cells (H). WT indicates subjects not carrying the variant; MM indicates subjects homozygous for the T rs11237379/NDUFC2 variant. Results are presented as mean values ± SEM. Statistical significance by ANOVA followed by Bonferroni’s posthoc test; *p < 0.05 **p < 0.001 ***p < 0.0001 for the indicated comparisons.