
Figures & data
Figure 1. The GID-complex regulates autophagic flux and MTOR signaling. (A) Schematic representation of CRISPR-CAS9 generated rmnd5a (NCBI Reference Sequence: NM_024288.2) knockout mutant (rmnd5a-KO, hereinafter referred to as KO) in NIH-3T3 cells (hereinafter referred to as WT). Three sgRNA-targeting sites (blue) and a pair of genotyping primers (gray) are depicted. Oligonucleotide sequences are listed in . (B) genotyping PCR of KO. (C and D) Western blot of MTOR signaling and autophagy markers. Cells were grown on starvation medium (DMEM without glucose and serum; +) or DMEM (-) for 24 h. ACTB/β-actin as loading control. Quantification showing relative protein level of p-RPS6 compared with RPS6 (pink) and LC3-II compared with ACTB (blue). Unpaired t-test n = 3. **, P < 0.01. Abbreviations: p-, phosphorylated; SE, short exposure; LE, long exposure. (E and F) Representative confocal microscope images with autophagosomes (green). Cells were treated with Bafilomycin A1 (BafA1, 100 nM) for 4 h to block autophagosomes fusion with lysosomes. Autophagosomes were stained with anti-LC3B antibody. Scale bars, 10 μm. Quantification showing relative amount of autophagosomes (relative fluorescence area, left). Average values of WT are set to 1. Unpaired t-test n = 15. **, P < 0.01. (G and H) Western blot of SQSTM1 turnover. Cells were treated with cycloheximide (CHX, 100 μg/ml, protein synthesis inhibitor) for 24 h. ACTB/β-actin as loading control. Quantification showing relative protein level of SQSTM1 compared with ACTB. The half-life of SQSTM1 in WT cells (black), KO cells (red), KO cells treated with BafA1 (yellow) and KO cells treated with MG132 (blue) shown by dotted line (supplementary western blot shown in Figure S1D). WT cells at 0 h are set to 1.
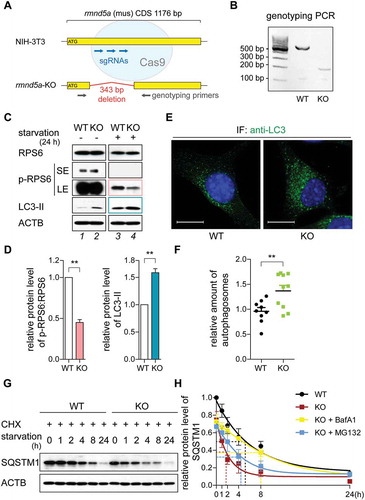
Figure 2. The GID-complex regulates AMPK activity. (A and B) Western blot of AMPK activity markers. Cells were grown on starvation medium (DMEM without glucose and serum; +) or DMEM (-) for 24 h. ACTB as loading control. Long exposure blot shown in Figure S2A. Quantification showing relative protein level of p-PRKAA compared with PRKAA (B). Unpaired t-test n = 3. *, P < 0.05; **, P < 0.01. (C) Western blot of AMPK activity markers. WT cells were transfected with siRNA against Rmnd5a. KO cells were transfected with plasmid encoding mouse Rmnd5a (NCBI Reference Sequence: NM_024288.2) or Rmnd5a RING domain C354S mutant (Rmnd5aC354S). After 24 h (plasmid) or 48 h (siRNA) of transfection, cells were subsequently starved for additional 24 h (+). ACTB as loading control. Quantification showing relative protein level of p-PRKAA compared with PRKAA. Unpaired t-test n = 3. *, P < 0.05. (D) Western blot of p-PRKAA. Cells were starved for 24 h and samples taken at indicated time points. ACTB as loading control. Quantification shown in (H). (E-G) Western blot of AMPK-MTOR signaling axis markers. Cells were starved for 6 h. ACTB as loading control. Quantification showing relative protein level of p-PRKAA compared with PRKAA (F), and p-RPTOR compared with RPTOR (G). WT cells at 0 h set to 1. Unpaired t-test n = 3. **, P < 0.01. (H) Quantification of (D) showing relative protein level of p-PRKAA compared to ACTB. WT cells at 0 h set to 1. Unpaired t-test n = 3. *, P < 0.05.
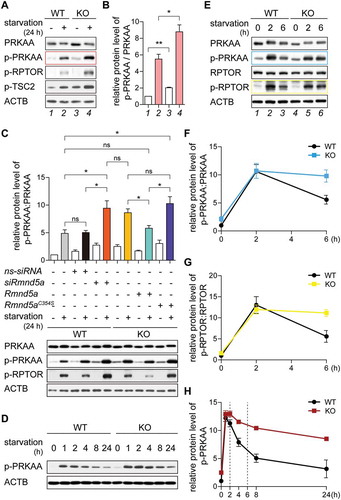
Figure 3. The GID-complex regulates the metabolic adaptation to cellular starvation independent of intracellular ATP levels. (A) Hierarchical clustering based on the correlation between proteome profiles based on 1207 protein groups quantified across the two cell lines. Three biological replicates were analyzed for each cell line. (B) Volcano plot depicting proteins differentially expressed between KO and WT cells. Significantly affected proteins (adj. P < 0.01) are displayed in red or blue according to whether they have higher or lower abundance in KO cells, respectively. Gene names of 40 most affected proteins (sorted by p value) are shown. (C) Gene set enrichment analysis was performed on proteomic data using KEGG pathways. Gene sets are plotted according to the Normalized Enrichment Score (NES) values. Positive and negative values are used for gene sets showing higher and lower abundance in KO cells, respectively. Only pathways significantly enriched (FDR < 0.1) are shown. (D) ATP concentration in WT and KO cells. Unpaired t-test n = 3. P = 0.1761. (E) Seahorse XF Cell Mito Stress Test. Mitochondrial respiration was assessed via oxygen consumption rate (OCR). Abbreviations: resp., respiration; prod., production. (F) Quantification of ATP production (orange area) showing no significant difference between WT and KO cells. Unpaired t-test n = 3. P = 0.3513. (G) Seahorse Glycolysis Stress Test. Glycolytic function was assessed via extracellular acidification rate (ECAR). (H) Quantification of glycolysis (the blue area) showing no significant difference between WT and KO cells. Unpaired t-test n = 3. P = 0.2533.
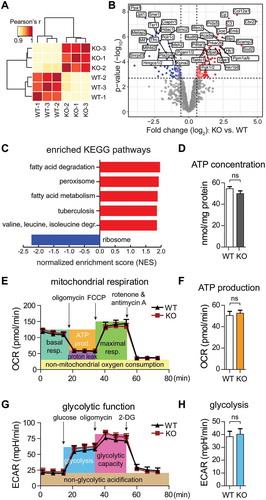
Table 3. Plasmids used in this study.
Table 4. Antibodies used in this study.
Table 5. Statistics for RNAi knockdown of Gid orthologs in C. elegans.
Table 6. Peptides and protein IDs of GID-complex subunits identified after PRKAA/AMPK immunoprecipitation in KO cells.
Table 7. Absolute concentration of metabolic compounds in WT and KO cells.
Figure 4. The GID-complex regulates K48-dependent polyubiquitination of AMPK. (A and B) Western blot of p-PRKAA. Cells were starved for 6 h with (+) or without (-) MG132 treatment (10 μM, proteasome inhibitor). ACTB as loading control. Quantification showing relative protein level of p-PRKAA compared to ACTB in WT cells. (C) Western blot of PRKAA ubiquitination. Cells were starved for 2 h, then treated with starvation medium containing MG132 for additional 4 h. Cell lysates were immunoprecipitated by anti-PRKAA antibody and immunoblotted with TUBE (high affinity ubiquitin binding peptide). (D and E) Western blot of p-PRKAA. WT cells transfected with different ubiquitin mutants for 24 h, then starved for 6 h. ACTB as loading control. Quantification showing relative protein level of p-PRKAA compared to ACTB. Abbreviations: Ub, wild-type ubiquitin; Ub[K48], ubiquitin with one lysine residue left at position 48; UbK48R, ubiquitin with K48R mutation. Plasmids shown in . (F and G) Western blot of PRKAA and p-PRKAA turnover. Cells were starved for 24 h and simultaneously treated with CHX. ACTB as loading control. Quantification showing relative protein level compared to ACTB. WT cells starved for 1 h are set to 1.
![Figure 4. The GID-complex regulates K48-dependent polyubiquitination of AMPK. (A and B) Western blot of p-PRKAA. Cells were starved for 6 h with (+) or without (-) MG132 treatment (10 μM, proteasome inhibitor). ACTB as loading control. Quantification showing relative protein level of p-PRKAA compared to ACTB in WT cells. (C) Western blot of PRKAA ubiquitination. Cells were starved for 2 h, then treated with starvation medium containing MG132 for additional 4 h. Cell lysates were immunoprecipitated by anti-PRKAA antibody and immunoblotted with TUBE (high affinity ubiquitin binding peptide). (D and E) Western blot of p-PRKAA. WT cells transfected with different ubiquitin mutants for 24 h, then starved for 6 h. ACTB as loading control. Quantification showing relative protein level of p-PRKAA compared to ACTB. Abbreviations: Ub, wild-type ubiquitin; Ub[K48], ubiquitin with one lysine residue left at position 48; UbK48R, ubiquitin with K48R mutation. Plasmids shown in Table 3. (F and G) Western blot of PRKAA and p-PRKAA turnover. Cells were starved for 24 h and simultaneously treated with CHX. ACTB as loading control. Quantification showing relative protein level compared to ACTB. WT cells starved for 1 h are set to 1.](/cms/asset/eabeb152-79fa-40a0-abfe-6bd58f2325cd/kaup_a_1695399_f0004_c.jpg)
Figure 5. The GID-complex alters primary cilia length by regulating AMPK activity. (A) Representative microscope images of primary cilia. Cells were treated with cilia-inducing medium (high-glucose DMEM with 0.5% serum) for 24 h. Ciliary axoneme were stained with anti-acetylated TUBA4A (ac-tubulin) antibody (green). Scale bars, 10 μm. (B) Quantification of primary cilia length. Cells were transfected with Rmnd5a or Mkln1 siRNA for 24 h, then treated with cilia-inducing medium for 24 h. Knockdown efficiency is shown in Figure S3D. Mean ± SEM of column: WT, 4.643 ± 0.1355 μm (n = 40); KO, 5.375 ± 0.1485 μm (n = 59); ns-siRNA, 4.894 ± 0.1559 μm (n = 17); siRmnd5a, 5.464 ± 0.1920 μm (n = 29); siMkln1, 5.574 ± 0.1325 μm (n = 30). Unpaired t-test, *, P < 0.05; ***, P < 0.001. Oligonucleotide sequences shown in . (C) Quantification of primary cilia length. Cells were treated with cilia-inducing medium containing Torin1 (1 μM, MTOR signaling inhibitor) or Compound C (10 μM, AMPK inhibitor) for 24 h. Mean ± SEM: WT with DMSO (control) 4.491 ± 0.1566 μm (n = 48); WT with Torin1, 5.472 ± 0.3986 μm (n = 27); WT with Compound C, 3.655 ± 0.1396 μm (n = 51); KO with DMSO 5.133 ± 0.2301 μm (n = 37); KO with Torin1, 6.275 ± 0.3337 μm (n = 40); KO with Compound C, 3.914 ± 0.1652 μm (n = 43). Unpaired t-test, *, P < 0.05; **, P < 0.01; ***, P < 0.001. (D) Western blot of AMPK markers. Cells were treated with cilia-inducing medium for 24 h to induce ciliogenesis, afterward shifted to starvation medium for 6 h. ACTB as loading control. (E) Like (D), with previous transfection of siRNA against Ift88 (Mus musculus, NM_009376.2) for 24 h to block cilia formation. (F) Representative microscope images of primary cilia. WT cells were transfected with siRNA against Ift88. Ciliary axoneme was stained by anti-ac-tubulin antibody (red). Scale bars, 10 μm.
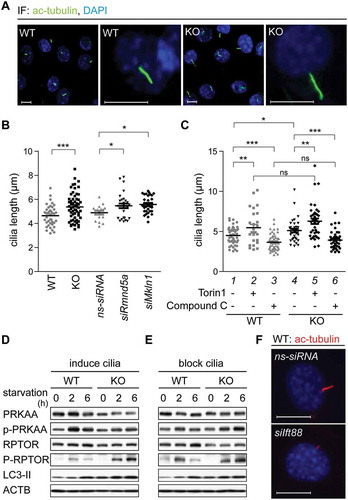
Figure 6. GID-complex proteins regulate organismal lifespan. (A) Survival rates of C. elegans depleted of Gid orthologs (gid1/y54e5a.7, gid2/t07d1.2, gid7/y39h10a.6, gid8/f53e2.1) through RNAi. Experiments were conducted in quintuplicates and were performed two independent times (details in ). One representative experiment is shown. Log-rank test, p < 0.0001. Knockdown efficiency shown in Figure S3E. (B) Model of GID-complex dependent regulation of AMPK activity. The GID-complex as a negative regulator of AMPK activity to adjust AMPK activity at times of prolonged starvation. p-AMPK activity is adjusted by K48-dependent polyubiquitination and subsequent proteasomal degradation. This process is disturbed when cells are lacking GID-complex activity, resulting in increased AMPK activity, reduced MTOR activity and increased autophagic flux.
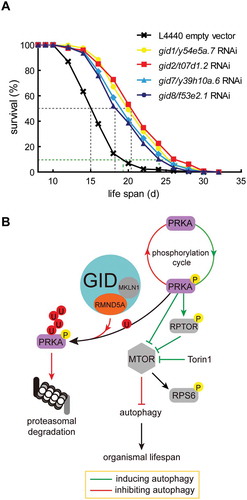
Table 1. Proteins of the Gid-complex with accession numbers and protein domains.
Table 2. Oligonucleotides used in this study.