Figures & data
Figure 1. eMI in Drosophila fat body. (A) eMI is typically analyzed using a biosensor consisting of a KFERQ-targeting motif fused to a photoactivatable mCherry that is co-expressed with an (endo)lysosomal marker consisting of a fragment of human LAMP1 fused to GFP. Upon expression in the larval fat body and prolonged starvation, the sensor forms puncta that partially colocalize with lysosomes (schematized as orange puncta in the fat body lattice). (B) Typical image showing the eMI sensor in red, (endo)lysosomes in green, and nuclei in blue. (B’ and B’’) show monochrome panels of the indicated channels. Scale bars: 20 µm.
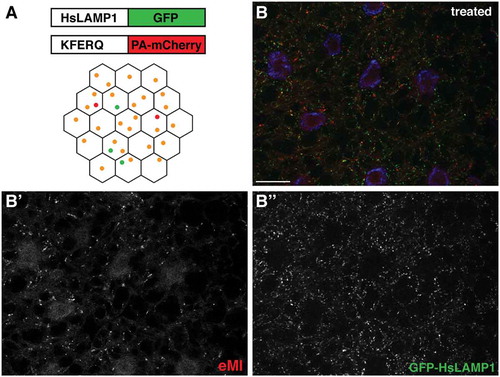
Figure 2. Flow chart part 1. Upon launching the SParQ plug-in (A), the user is prompted to navigate to the image folder (B), to select the file format (C), the channel (D) and the particle size (E) to be analyzed.
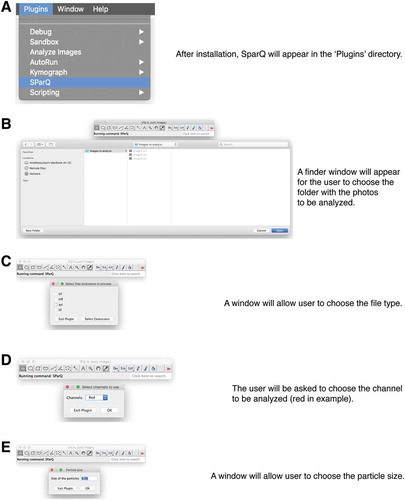
Figure 3. Flow chart part 2. SParQ then opens the original image next to a greyscale image of the selected channel (A) for thresholding (B). (C) A mask of the thresholded image will be shown allowing the user to accept or to repeat thresholding. Nuclei will be shown in case they need to be counted.
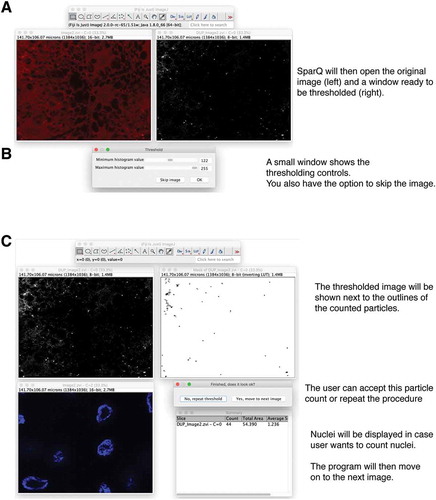
Figure 4. Flow chart part 3. After all images are processed, SParQ will summarize the process and export the data into an Excel file.
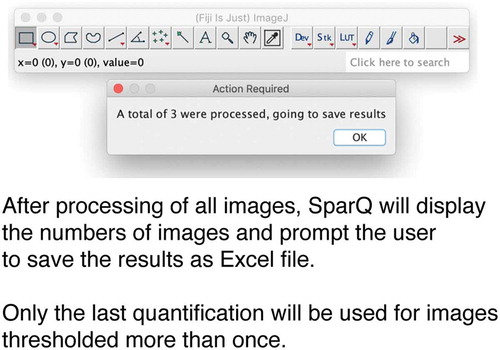
Figure 5. eMI sensor based on regular cherry form puncta upon prolonged starvation. Compared to fed control (A), 25 h starvation induced robust sensor puncta (B). (C) Quantification of eMI response. Scale bar: 20 µm.
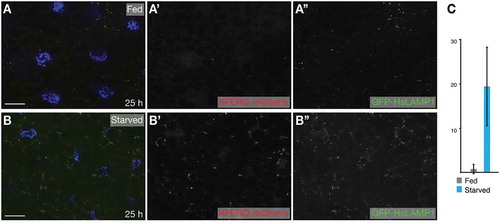
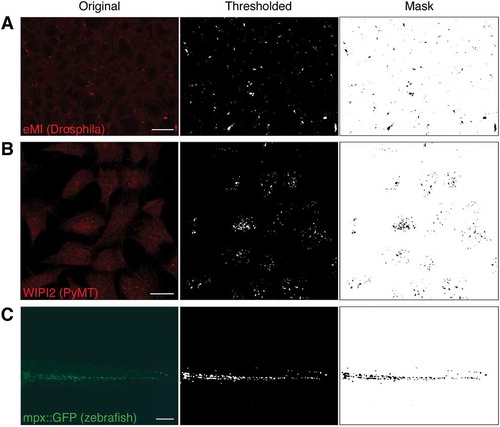
Figure 6. Examples of original sample images (left column), thresholded channel (middle column), and mask used to quantify (right column). (A) Typical eMI analysis. (B) Mouse PyMT cells stained for the autophagy protein WIPI2. (C) Tail section of a 4 d post fertilization zebrafish embryo expressing GFP in neutrophils under the control of the myeloperoxidase (mpx) promoter. Scale bars: 20 µm (A, B) and 100 µm (C).