Figures & data
Figure 1. Inhibiting MTORC1 promotes autophagosome sequestration of LDs in adipocytes in vivo and in vitro. (A) Staining of LC3 and LAMP1 and colocalization of LC3 and LAMP1 with LDs was significantly increased in isolated RPTOR-deficient primary adipocytes. Adipocytes were isolated from WAT, stained and analyzed using Amnis Imaging Flow Cytometer. RKO, rptor KO. (B) The levels of LC3 and LAMP1 in isolated adipocytes in Figure 1A were quantified. (C) RPTOR deficiency induced LC3 flux in isolated primary adipocytes of WAT. The mice were administered with leupeptin (40 mg/kg body weight) by IP injection for 2 h, and tissue samples were collected for western blot. Leu, leupeptin; LC3-I/II-L, LC3-I/II with long exposure; LC3-I/II-S, LC3-I/II with short exposure. (D) The levels of LC3-II in Figure 1C were quantified. (E) RPTOR deficiency significantly elevated LC3B puncta in primary differentiated adipocytes. After differentiation, adipocytes were cultured in the fresh regular medium for 24 h. Veh, vehicle. Staining of LAMP1 (F) and LysoTracker (G) was upregulated by RPTOR deficiency in primary adipocytes. After differentiation, adipocytes were cultured in the fresh regular medium for 24 h. LC3B, LAMP1 puncta and LysoTracker Red puncta (target objects) were computer-identified after staining, and 2,000 primary objects were counted per well. The data in Figure 1B,D–G are presented as the mean ± S.E.M. *p < 0.05, **p < 0.01.
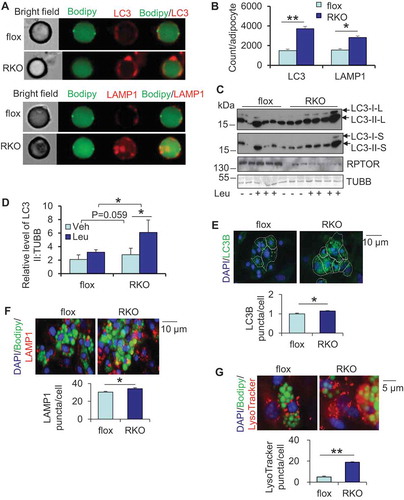
Figure 2. Inhibiting MTORC1 lead to the degradation of LDs, which was rescued by inhibiting lysosome function. The stromal vascular fraction was isolated from white adipose tissue, cultured and differentiated into adipocytes. After differentiation, adipocytes were cultured in the regular medium that was changed every two days for up to 6 days for the following studies. (A) The number of large LDs decreased 8 days post differentiation. D6, day 6; D8, day 8; D10, day 10. (B) Oil red O staining on day 10 of differentiated rptor KO and control adipocytes. 5 representative bright-field images were taken for each well under microscope and the results from 3 individual experiments were used for quantification with Image J software. (C) Fluorescence staining of Bodipy and PLIN1 of day 6 and day 10 differentiated rptor KO and control adipocytes. The area of LDs was analyzed by Cellomic Image System. (D) Expression of P-ULK1757, ULK1 and adipogenic markers PLIN1, PPARG on day 6 and day 10 differentiated rptor KO and control adipocytes. Representative electron microscopy images for lysosomes (E) and autophagosomes (F) on day 6 differentiated rptor KO and control adipocytes. LD, Lipid droplet; Ly, lysosome; M, mitochondria; N, nucleus; AS, autophagosome. (G) Inhibiting lysosomes rescued RPTOR deficiency-suppressed LD maturation during primary adipogenesis. Day 6 differentiated rptor KO and control adipocytes were treated by 10 µM leupeptin for 4 days. The data in Figure 2B–G are presented as the mean ± S.E.M. *p < 0.05, **p < 0.01.
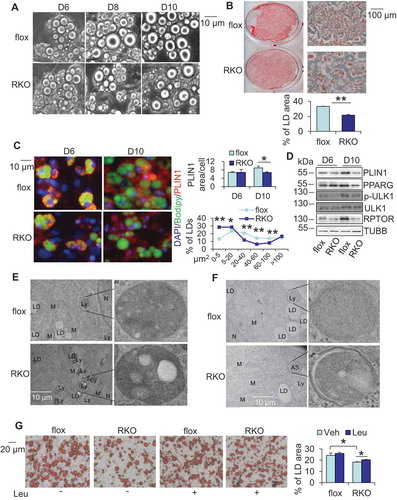
Figure 3. RPTOR deficiency-induced LD degradation was reversed by inhibiting lipolysis in primary adipocytes. RPTOR deficiency increased basal and isoproterenol-induced release of glycerol (A) and free fatty acids (B) from WAT. Dissected fat tissue samples were cultured in 2% FFA-free BSA media in the presence or absence of 10 μM isoproterenol for 2 h, and the media was collected for ELISA analysis. ISO, isoproterenol. RPTOR depletion enhanced basal and isoproterenol-induced release of glycerol (C) and free fatty acids (D) in primary adipocytes. Cells were washed with PBS and incubated in 2% BSA medium in the presence or absence of 10 μM isoproterenol for 2 h, and the media was collected for the ELISA analysis. (E) The basal and isoproterenol-induced phosphorylation of LIPE at Ser563 was enhanced by RPTOR deficiency in primary adipocytes. (F) Treatment with lipolysis inhibitor Atglistatin suppressed RPTOR deficiency-induced LD degradation during adipogenesis. Day 6 differentiated adipocytes were treated with or without 5 µM Atglistatin for 4 days. (G) Oil red O staining of cells with or without lipolysis inhibitor, Atglistatin, in rptor KO and control adipocytes. (H) Treatment with lipolysis inhibitor, Atglistatin, restored adipogenic markers downregulated by RPTOR deficiency during adipogenesis. Figure 3E–H were the representative data from three individual experiments. The data in Figure 3A–D,G are presented as the mean ± S.E.M. *p < 0.05, **p < 0.01.
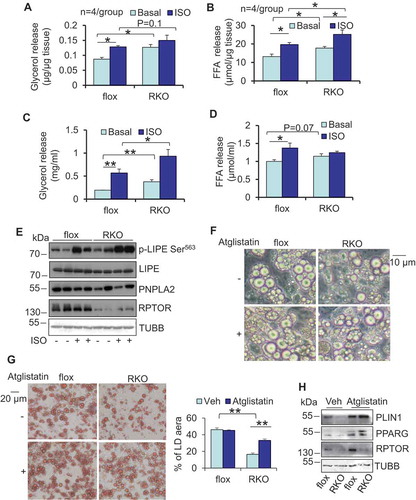
Figure 4. ATG7 deficiency suppressed lipolysis and protected against rapamycin-induced LD degradation in primary adipocytes. ATG7 deficiency decreased isoproterenol-induced release of glycerol (A) and free fatty acids (B) of WAT. Dissected fat tissue samples were cultured in 2% FFA-free BSA media in the presence or absence of 10 μM isoproterenol for 4 h, and the media was collected for ELISA analysis. Aflox, atg7 floxed; AKO, atg7 KO. Treatment of isoproterenol increased puncta LC3B, LAMP1 (C) and LysoTracker (D) in primary differentiated adipocytes. (E) ATG7 depletion suppressed isoproterenol-induced release of glycerol in circulation in vivo. Fasted mice were administered with an isoproterenol (10 mg/kg body weight) for 15 min. (F) Isoproterenol-induced release of glycerol was decreased in atg7 KO primary adipocytes compared to the control cells. Cells were washed with PBS and incubated in 2% BSA medium in the presence or absence of 10 μM isoproterenol for 2 h, and the media was collected for the ELISA analysis. The Bodipy and LAMP1 staining (G), Brightfield image and Oil red O staining (H) of differentiated atg7 KO and control adipocytes treated with or without rapamycin. Rapa, rapamycin. The differentiated atg7 KO and control adipocytes were treated with or without 5 nM rapamycin on day 6 for 24 h. The data in Figure 4A–H are presented as the mean ± S.E.M. *p < 0.05, **p < 0.01.
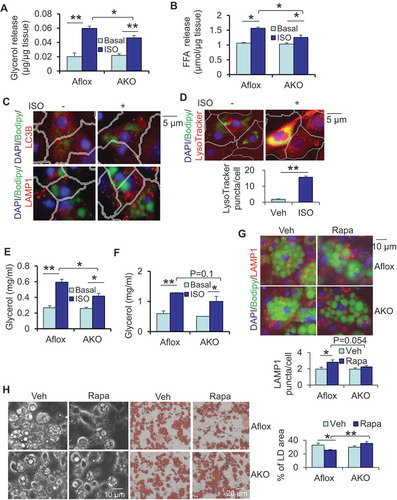
Figure 5. ATG7 depletion improved adipocyte development in rptor KO mice. 10-week old male mice were used for the following studies (A) The expression levels of ATG7 and RPTOR were dramatically suppressed in atg7 rptor double-KO (dKO) adipose tissue, while they were minimally affected in other types of tissue. (B) ATG7 deficiency partially restored fat mass, while having no significant effect on lean mass in rptor KO mice. Lean mass, fat mass, total mass and fat percentage were determined by DEXA scanning. dflox: atg7 rptor double-flox; dKO: atg7 rptor double-KO. (C) ATG7 deficiency differentially restored loss of mass in epidydimal WAT, inguinal WAT, and BAT without significant effect on liver, heart, pancreas and kidney in rptor KO mice. The mass of organs or fat pads were weighed after mice were euthanized. (D) The representative image of eWAT, BAT and liver in rptor flox, rptor KO, atg7 rptor double-flox and atg7 rptor double-KO mice. (E) H&E staining of iWAT, eWAT, BAT, and liver in rptor flox, rptor KO, atg7 rptor double-flox and atg7 rptor double-KO mice. Quantification of adipocyte size (F) and adipocyte number/area (G) in iWAT of rptor KO, atg7 rptor double-KO and control mice from Figure 5E. Five sections per animal were stained. Eight representative images per section were used to determine adipocyte size, and at least three 20× fields of three mice per genotype were used for quantification of adipocyte number. Size of adipocytes were determined with ImageJ Analysis of H&E stained tissues. Figure 5A,D,E were the representative data from three individual experiments. The data in Figure 5B,C,F,G are presented as the mean ± S.E.M. * p < 0.05. For Figure 5F, *p < 0.05, **p < 0.01, flox vs RKO; # p < 0.05, ##p < 0.01, dflox vs dKO.
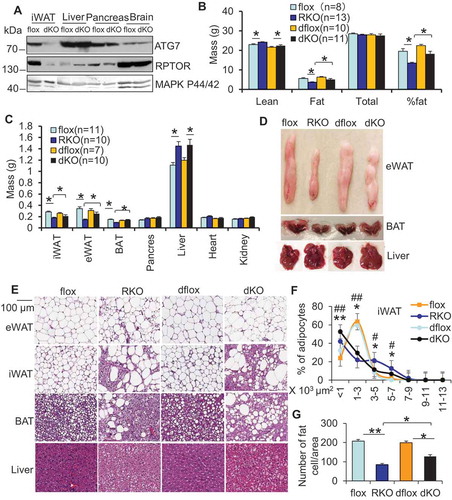
Figure 6. ATG7 depletion decreased lipolysis and rescued adipocyte maturation in rptor KO mice. ATG7 deficiency reversed the increase in basal and isoproterenol-induced release of glycerol (A) and free fatty acids (B) of WAT in rptor KO mice. Epididymal fat pads were collected from the fasting mice and used for ex vivo lipolysis assay. ATG7 deficiency upregulated expression levels of adipogenic markers PPARG and PLIN1 in rptor KO WAT (C) and BAT (D) despite no significant effect on ADIPOQ levels. (E) ATG7 deficiency partially restored LD degradation in rptor KO adipocytes on day 10 of differentiation. Five representative bright-field or Oil red O staining images were taken for each well under microscope and the results from 3 individual experiments were used for quantification with Image J software. (F) Representative electron microscopy images for lysosomes, on Day 6 differentiated rptor KO, atg7 rptor double-KO and control adipocytes. LD, lipid droplet; Ly, lysosome; N, nucleus; Figure 6E,F were the representative data from three individual experiments. The data in Figure 6A,B,E are presented as the mean ± S.E.M. *p < 0.05, **p < 0.01.
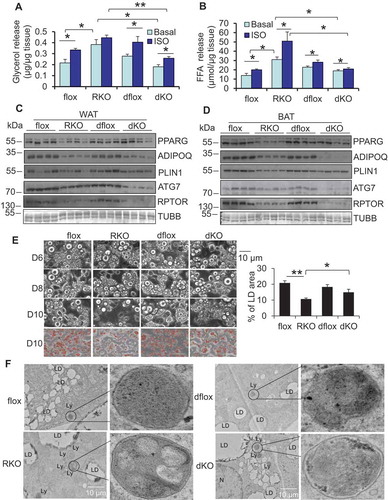
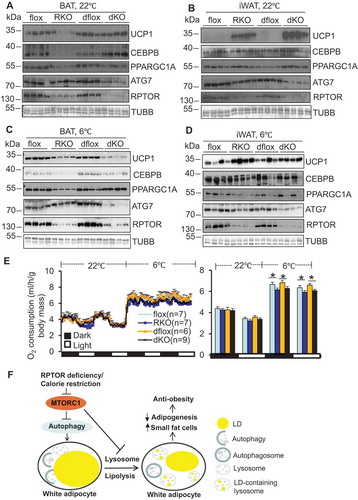
Figure 7. ATG7 depletion restored thermogenic gene expression in rptor KO BAT. For the following studies, mice were individually housed in the metabolic cages coupled with a chamber at room temperature (22°C) for 72 h or at room temperature (22°C) for 24 h followed by cold exposure (6°C) for 48 h. (A) ATG7 deficiency restored expression levels of UCP1 and CEBPB, but not PPARGC1A in rptor KO BAT at room temperature. (B) ATG7 deficiency further upregulated expression levels of UCP1 in rptor KO iWAT at room temperature. (C) ATG7 deficiency further suppressed cold-induced expression levels of UCP1 despite the upregulation of CEBPB and PPARGC1A in rptor KO BAT under cold stress conditions. (D) ATG7 deficiency had no significant effect on the expression levels of UCP1 in rptor KO iWAT under cold stress condition. (E) O2 consumption in rptor flox, rptor KO, atg7 rptor double-flox and atg7 rptor double-KO under 22°C and 6°C. (F) A working model summarizing autophagy-mediated lipolysis that leads to impaired adipocyte maturation and adipogenesis. The average O2 consumption was normalized to whole-body mass and analyzed using Student’s t-test. The data in Figure 7E are presented as the mean ± S.E.M. *p < 0.05.