Figures & data
Figure 1. Podocytes exhibit high levels of basal autophagy and autophagic flux. (A) Representative images obtained from cryosections of 4-month old Gfp-Lc3 mice stained for the basement membrane marker NID1/nidogen-1/entactin (red) and GFP-LC3 (green). (B) Two-photon images of glomeruli from Gfp-Lc3 mice perfused with dextran as a marker for glomerular capillaries (in red) displaying autophagosomes in vivo (in green, marked with arrow). (C) Representative images obtained from cryosections of 4-month-old Rfp-Gfp-Lc3 mice stained for NID1 (purple). RFP-LC3 and GFP-LC3 fluorescence is endogenous. (D) Quantification of (C) out of 30 glomeruli from 3 mice each with surrounding tubular cells (** ≤ 0.01, * ≤ 0.05). (E) Cryosections displaying glomeruli (upper panel) and tubular system (lower panel) stained for NID1 (red) and GFP-LC3 (anti-GFP antibody, green) in 4-month-old WT mice with and without chloroquine (4 h after chloroquine [Cq] administration i.p. 100 mg Cq/kg BW). (F) Western blot from immortalized human podocyte cell line and proximal tubular cell line (HK2) for MTORC1 downstream targets and LC3 abundance. (G) Densitometry obtained from (F) (** ≤ 0.01)
![Figure 1. Podocytes exhibit high levels of basal autophagy and autophagic flux. (A) Representative images obtained from cryosections of 4-month old Gfp-Lc3 mice stained for the basement membrane marker NID1/nidogen-1/entactin (red) and GFP-LC3 (green). (B) Two-photon images of glomeruli from Gfp-Lc3 mice perfused with dextran as a marker for glomerular capillaries (in red) displaying autophagosomes in vivo (in green, marked with arrow). (C) Representative images obtained from cryosections of 4-month-old Rfp-Gfp-Lc3 mice stained for NID1 (purple). RFP-LC3 and GFP-LC3 fluorescence is endogenous. (D) Quantification of (C) out of 30 glomeruli from 3 mice each with surrounding tubular cells (** ≤ 0.01, * ≤ 0.05). (E) Cryosections displaying glomeruli (upper panel) and tubular system (lower panel) stained for NID1 (red) and GFP-LC3 (anti-GFP antibody, green) in 4-month-old WT mice with and without chloroquine (4 h after chloroquine [Cq] administration i.p. 100 mg Cq/kg BW). (F) Western blot from immortalized human podocyte cell line and proximal tubular cell line (HK2) for MTORC1 downstream targets and LC3 abundance. (G) Densitometry obtained from (F) (** ≤ 0.01)](/cms/asset/4347df5b-dc05-4e75-9fca-9709c9de6611/kaup_a_1705007_f0001_c.jpg)
Figure 2. Basal autophagy is independent of MTOR activity in podocytes in vivo. (A) Schematic of generating podocyte-specific deletion of Rptor or Tsc1 using Nphs2-Cre mice and Cre-Lox technique. (B) Cryosections from 2-week-old mice bearing podocyte-specific knockout for Rptor and transgenic for Gfp-Lc3 compared to Gfp-Lc3 WT mice (NID1 in red, GFP-LC3 in green). (C) Quantification of GFP-LC3 autophagosomes per glomerular area out of 30 glomeruli each from 3 mice (ns, not significant). (D) Cryosections from 2-week-old mice bearing podocyte-specific knockout for Tsc1 and transgenic for Gfp-Lc3 compared to Gfp-Lc3 WT mice (NID1 in red, GFP-LC3 in green). (E) Quantification of GFP-LC3 autophagosomes per glomerular area out of 30 glomeruli each from 3 mice (ns, not significant). (F) Western blot out of glomerular lysates obtained from 2-week-old mice for MTORC1 downstream targets and LC3 and SQSTM1 abundance. (G) Densitometry for LC3-II, SQSTM1 and p-RPS6 obtained from 3 WT glomerular lysates and 3 glomerular lysates obtained from 2-week-old mice bearing a podocyte-specific deletion of Rptor or Tsc1, respectively (** ≤ 0.01, * ≤ 0.05, ns, not significant)
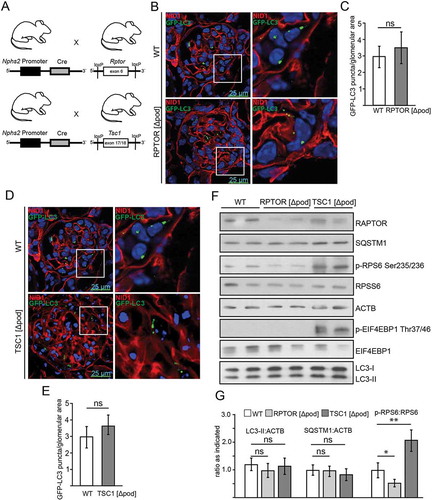
Figure 3. Basal autophagy is independent of MTOR activity in podocytes in vitro. (A) Schematic of generating mice with a podocyte-specific knockout for Tsc1 additionally harboring a Tomato-EGFP allele for primary cell isolation. (B) Schematic of generating mice with a podocyte-specific knockout for Rptor additionally harboring a Tomato-EGFP allele for primary cell isolation. (C) Primary podocytes with and without Rptor-deficiency are stained for LC3 in red (green: endogenous fluorescence due to Tomato-EGFP reporter and Nphs2-Cre). (D) Quantification of LC3 signal out of 30 primary podocytes from 3 mice each (ns, not significant). (E) Schematic illustrating proximity-ligation assay (PLA) for SQSTM1 and LC3. (F) Representative image of primary podocytes with and without Rptor and LC3-SQSTM1-PLA signal in red (green: endogenous fluorescence due to Tomato-EGFP reporter and NHPS2-Cre). (G) Quantification of PLA signal from 30 podocytes obtained from 3 mice each (ns, not significant). (H) Primary podocytes with and without Tsc1-deficiency stained for LC3 in red (green: endogenous fluorescence due to Tomato-EGFP reporter and Nphs2-Cre). (I) Quantification of LC3 signal out of 30 primary podocytes from 3 mice each (ns, not significant). (J) Western blot from primary podocytes for abundance of LC3, SQSTM1 and MTORC1 downstream targets. (K) Densitometry from (I) (** ≤ 0.01, ns, not significant)
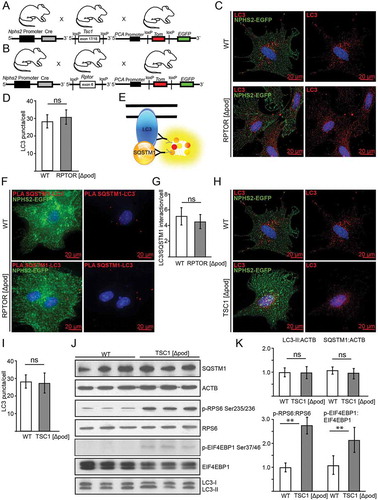
Figure 4. AMPK controls autophagy in podocytes. (A) Representative sections from 2-week-old mice bearing podocyte-specific deletion of Rptor or Tsc1 and controls stained for phosphorylated acetyl-CoA carboxylase Ser79 (p-ACACA) in red and NPHS1 (green). (B) Western blot out of glomerular lysates obtained from 2-week-old mice (genotype as indicated) for PRKAA and ULK1 and respective phosphorylation sites. (C) Densitometry for p-PRKAA Thr172 obtained from 3 WT glomerular lysates and 3 glomerular lysates obtained from 2-week-old mice bearing a podocyte-specific deletion of Rptor or Tsc1, respectively (** ≤ 0.01, * ≤ 0.05). (D) Densitometry for p-ULK1 Ser757, p-ULK1 Ser555 and p-ULK1 Ser317 obtained from 3 WT glomerular lysates and 3 glomerular lysates obtained from 2-week-old mice bearing a podocyte-specific deletion of Rptor or Tsc1, respectively (** ≤ 0.01, * ≤ 0.05). (E) Western blot from primary podocytes treated with AICAR (1 mM) for the time indicated (12 h or 24 h) to assess the abundance of p-ULK1 Ser555, p-PRKAA Thr172 and p-RPS6 Ser235/236. (F-H) Densitometry from (E) (** ≤ 0.01, * ≤ 0.05)
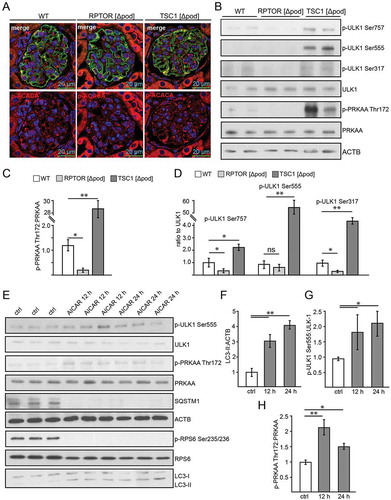
Figure 5. Activation of AMPK stimulates autophagy independently of MTORC1 activity. (A) Western blot from Tsc1-deficient podocytes and corresponding WT controls with and without AICAR treatment (1 mM, 24 h) to assess the abundance of phosphorylated forms of ULK1 and PRKAA as indicated. (B) Densitometry from (A) (** ≤ 0.01, * ≤ 0.05). (C) Representative section from 2-week-old mice bearing podocyte-specific deletion of Rptor with and without AICAR treatment (500 mg/kg BW 24 h and 4 h before harvest) stained with LC3 (red) and NPHS1/nephrin in green. (D) Representative section from 2-week-old mice bearing podocyte-specific deletion of Rptor with and without AICAR treatment (500 mg/kg BW 24 h and 4 h before harvest) stained with SQSTM1 (red) and NPHS1/nephrin in green. (E) Quantification of LC3 puncta per glomerular area (n = 3 each, 30 glomeruli counted per mouse, * ≤ 0.05). (F) Quantification of SQSTM1 puncta per glomerular area (n = 3 each, 30 glomeruli counted per mouse, * ≤ 0.05). (G) Western blot from glomerular lysates from 2-week-old mice bearing podocyte-specific deletion of Rptor with and without AICAR treatment (500 mg/kg BW 24 h and 4 h before harvest) to assess the abundance of LC3-II. (H) Densitometry from (G) (* ≤ 0.05)
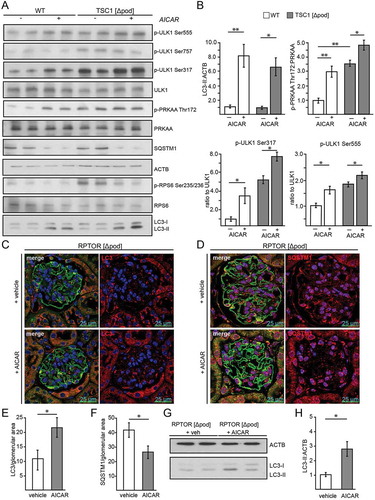
Figure 6. Effects of acute and long-term pharmacological inhibition of MTORC1 activity on autophagy. (A) Schematic of the short-term treatment regimen (rapamycin vs. vehicle, n = 5 each, rapamycin dose: 10 mg/kg BW i.p. for 3 d). (B) Quantification of GFP-LC3 autophagosomes per glomerular area out of 30 glomeruli each from 5 mice per group (vehicle vs. rapamycin). (C) Representative cryosections from 16-week-old mice transgenic for GFP-LC3 with and without rapamycin treatment (NID1 in red, GFP-LC3 in green, rapamycin dose: 10 mg/kg BW i.p. for 3 d). (D) Representative western blot from glomerular lysates from rapamycin and vehicle treated mice (WT mice, n = 3 each, rapamycin dose: 10 mg/kg BW i.p. for 3 d). (E) Densitometric quantification of (D) (** ≤ 0.01, * ≤ 0.05). (F) Schematic of the long-term treatment regimen (rapamycin dose: 4 mg/kg BW i.p. for 3 weeks). (G) Quantification of serum levels of rapamycin (n = 6 each) (*** ≤ 0.001). (H) Representative western blot from glomerular lysates from rapamycin long-term, short-term and vehicle treated mice. (I) Densitometry from 3 glomerular lysates of each treatment and vehicle controls for LC3-II, SQSTM1 and p-RPS6 Ser235/236 (** ≤ 0.01, ns, not significant). LT, long-term; ST, short-term
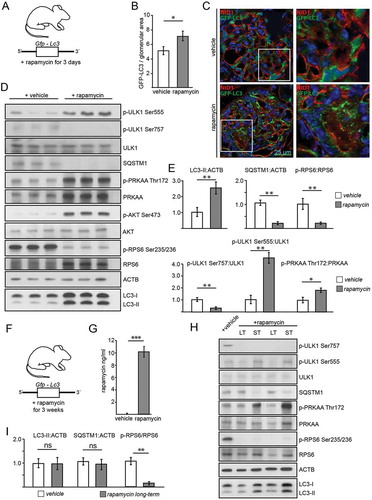
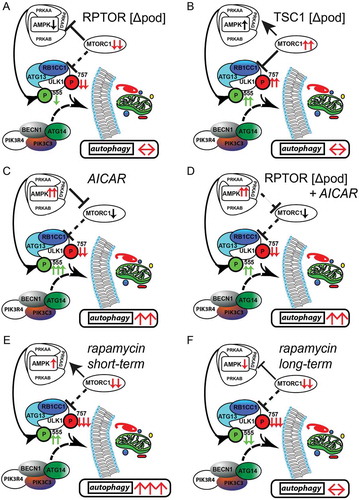
Figure 7. Activation of AMPK stimulates autophagy independently of MTOR activity. (A) AMPK activity is reduced if MTORC1 signaling is genetically impaired (activating phosphorylation sites at ULK1 are displayed in green, inhibitory sites are in red). (B) Inhibitory signals on ULK1 by genetically induced MTORC1 hyperactivity are compensated by active AMPK signaling. (C) Pharmacological activation of AMPK is able to induce autophagy in podocytes by activating ULK1. (D) MTORC1 can be bypassed in autophagy regulation as it occurs in the genetic model of MTORC1 inhibition by direct phosphorylation of ULK1 by AMPK. (E) Short-term treatment with rapamycin inhibits MTORC1 activity and activates AMPK leading to increased levels of autophagy. (F) Long-term treatment with rapamycin is compensated by reduced AMPK signaling in regard to autophagy regulation