
Figures & data
Figure 1. ULK1 depletion suppresses HCC progression in vitro and in vivo. (A) ULK1 depletion in HCC cells. Hep3B and primary HCC cells were transfected with the indicated siRNAs. After 24 h of transfection, the cell lysates were detected by western blotting with the indicated antibodies. (B) ULK1 silencing inhibited HCC cell proliferation. Hep3B and primary HCC cells were transfected with the indicated siRNAs, and proliferation activity was evaluated via EdU assays. (C, D) ULK1 knockout inhibited the proliferation and invasion of HCC cells. The proliferation and invasion activities of ULK1 [Con] and ULK1 [Cas9] HepG2 cells were evaluated via CCK-8 (C) and transwell (D) assays. (E-H) ULK1 deletion inhibited HCC growth in vivo. The data represent the quantified tumor weight (E), tumor growth curves (F), fluorescence area (G), and body weight (H) of the indicated groups. For panels a-d, the data are presented as representative and/or means ± s.e.m. of three independent assays. An unpaired two-sided Student’s t-test was used to compare two groups. **p < 0.01, ***p < 0.001.
![Figure 1. ULK1 depletion suppresses HCC progression in vitro and in vivo. (A) ULK1 depletion in HCC cells. Hep3B and primary HCC cells were transfected with the indicated siRNAs. After 24 h of transfection, the cell lysates were detected by western blotting with the indicated antibodies. (B) ULK1 silencing inhibited HCC cell proliferation. Hep3B and primary HCC cells were transfected with the indicated siRNAs, and proliferation activity was evaluated via EdU assays. (C, D) ULK1 knockout inhibited the proliferation and invasion of HCC cells. The proliferation and invasion activities of ULK1 [Con] and ULK1 [Cas9] HepG2 cells were evaluated via CCK-8 (C) and transwell (D) assays. (E-H) ULK1 deletion inhibited HCC growth in vivo. The data represent the quantified tumor weight (E), tumor growth curves (F), fluorescence area (G), and body weight (H) of the indicated groups. For panels a-d, the data are presented as representative and/or means ± s.e.m. of three independent assays. An unpaired two-sided Student’s t-test was used to compare two groups. **p < 0.01, ***p < 0.001.](/cms/asset/8f169881-a34b-4637-bc69-99c190af46ef/kaup_a_1709762_f0001_c.jpg)
Figure 2. ULK1 depletion increases the therapeutic effects of sorafenib in vitro and in vivo. (A) Sorafenib induced autophagy in HepG2 cells. HepG2 cells were treated with sorafenib (5 μM) for 12 h. The data are representative TEM images of three independent assays. The arrows indicate Avd. The ratio of autophagic vacuole area to the cytoplasmic area was determined by morphometric analysis. (B) The effects of 3-MA (2 mM), sorafenib (5 μM), 3-MA (2 mM) + sorafenib (5 μM) on the LC3-II levels in HepG2 cells. (C) Autophagy inhibition increased the anti-invasion effects of sorafenib in HepG2 cells. HepG2 cells were evaluated via transwell assays with the indicated treatments (sorafenib: 5 μM; 3-MA: 2 mM) for 24 h. (D, E) ULK1 silencing increased the antiproliferation effects of sorafenib. Hep3B and primary HCC cells were transfected with the indicated siRNAs. After 24 h of transfection, the cells were treated with sorafenib for 24 h, and proliferation activity was evaluated via EdU assays. (F, G) ULK1 depletion increased the therapeutic effects of sorafenib in vitro. ULK1 [Con] and ULK1 [Cas9] HepG2 cells were treated with sorafenib (5 μM) for 24 h, and proliferation and invasion activities were evaluated via CCK-8 (F) and transwell (G) assays. (H-K) ULK1 depletion increased the therapeutic effects of sorafenib in vivo. The data represent the body weight growth (H), quantified tumor weight (I), tumor growth curves (J), and fluorescence area and photographs of representative tumors (K). For panel A-G, the data are presented as representative and/or means ± s.e.m. of three independent assays. For panel H-K, the data are the mean ± s.e.m. (n = 10 per group). For panel A, an unpaired two-sided Student’s t-test was used to compare two groups. For panels B, C, D, E, F, G, H, I, J, and K, one-way ANOVA was used to compare multiple groups. *p < 0.05, **p < 0.01, ***p < 0.001.
![Figure 2. ULK1 depletion increases the therapeutic effects of sorafenib in vitro and in vivo. (A) Sorafenib induced autophagy in HepG2 cells. HepG2 cells were treated with sorafenib (5 μM) for 12 h. The data are representative TEM images of three independent assays. The arrows indicate Avd. The ratio of autophagic vacuole area to the cytoplasmic area was determined by morphometric analysis. (B) The effects of 3-MA (2 mM), sorafenib (5 μM), 3-MA (2 mM) + sorafenib (5 μM) on the LC3-II levels in HepG2 cells. (C) Autophagy inhibition increased the anti-invasion effects of sorafenib in HepG2 cells. HepG2 cells were evaluated via transwell assays with the indicated treatments (sorafenib: 5 μM; 3-MA: 2 mM) for 24 h. (D, E) ULK1 silencing increased the antiproliferation effects of sorafenib. Hep3B and primary HCC cells were transfected with the indicated siRNAs. After 24 h of transfection, the cells were treated with sorafenib for 24 h, and proliferation activity was evaluated via EdU assays. (F, G) ULK1 depletion increased the therapeutic effects of sorafenib in vitro. ULK1 [Con] and ULK1 [Cas9] HepG2 cells were treated with sorafenib (5 μM) for 24 h, and proliferation and invasion activities were evaluated via CCK-8 (F) and transwell (G) assays. (H-K) ULK1 depletion increased the therapeutic effects of sorafenib in vivo. The data represent the body weight growth (H), quantified tumor weight (I), tumor growth curves (J), and fluorescence area and photographs of representative tumors (K). For panel A-G, the data are presented as representative and/or means ± s.e.m. of three independent assays. For panel H-K, the data are the mean ± s.e.m. (n = 10 per group). For panel A, an unpaired two-sided Student’s t-test was used to compare two groups. For panels B, C, D, E, F, G, H, I, J, and K, one-way ANOVA was used to compare multiple groups. *p < 0.05, **p < 0.01, ***p < 0.001.](/cms/asset/ec5145ae-9557-47e0-8084-6dbe7aedf201/kaup_a_1709762_f0002_c.jpg)
Figure 3. Structure-based virtual screening for the discovery of ULK1 inhibitors. (A) The overall structure of ULK1. The key features are the phosphorylated threonine in the activation loop, the inhibitor, and the interlobe loop. (B) Results from virtual screening (using AutoDock Vina) of a compound library of our group and the National Cancer Institute Diversity Set 2 against ULK1. The bars represent the numbers of the diversity set compounds with predicted free energies of binding in the indicated 1 kcal/mol bins. (C) Workflow for candidate drug compound selection. (D) Surface view of the 15 selected compounds bound to ULK1. The compound is shown in yellow. (E) Toxicity and pharmacokinetics of XST-14 (as an example) according to ADMET Alog98, Absorption-95, Absorption-99, BBB-95, and BBB-99. (F) Surface view of XST-14 (as an example) bound to ULK1. The compound is shown in blue with a spherical rendering. (G) Close-up view of XST-14 bound to ULK1. The electron density is from a Fo − Fc difference map contoured at 3σ. The key residues that contact the inhibitor are labeled. XST-14 is shown in green.
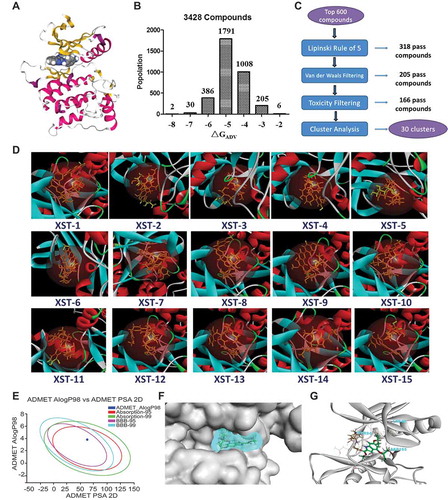
Figure 4. XST-14 is a potent ULK1 kinase inhibitor that binds to the KD of ULK1. (A) Chemical structure and chemical synthesis route of XST-14, a ULK1 competitive kinase inhibitor. (B) The kinetic interactions of XST-14 and the ULK1 protein were determined by surface plasmon resonance (SPR) analyses. The indicated concentrations of XST-14 were passed over immobilized ULK1 on CM5 sensor chips. The affinity constants were evaluated using BIAevaluation software. (C) The kinetic interactions of XST-14 and the KD truncation of the ULK1 protein were determined by SPR analyses. The indicated concentrations of XST-14 were passed over immobilized KD on streptavidin (SA) sensor chips. The affinity constants were evaluated using BIAevaluation software. (D-F) The kinetic interactions of the mutated KD and XST-14 were determined by SPR analyses. The indicated concentrations of XST-14 were passed over the immobilized mutants of the KD on CM5 sensor chips. The affinity constants were evaluated using BIAevaluation software. (G) The half maximal inhibitory concentration (IC50) for XST-14 against ULK1 was determined using an in vitro kinase assay. XST-14 was tested in triplicate in a 12-dose IC50 mode with a starting dose of 100 μM. The data are the means ± SEM. (H, I) The kinase selectivity profile for XST-14 was determined using SelectScreen Kinase Profiling Services. Briefly, XST-14 was screened at a 5 μM dose for its ability to impair the binding of a panel of 403 kinases to the substrate in an in vitro binding assay. The red box indicates >75% inhibition. (J) The summary of IC50 measurements for each kinase is presented in this table.
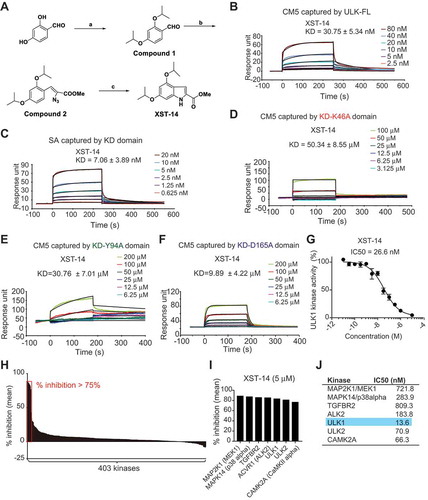
Figure 5. XST-14 induces autophagy inhibition by reducing the phosphorylation of the ULK1 downstream substrate. (A) XST-14 deceased LC3-I conversion to LC3-II. CHO cells stably expressing GFP-LC3 were incubated with XST-14 (5 μM) or 3-MA (2 mM) for 12 h and analyzed by flow cytometry. The fluorescence intensity is directly correlated with LC3-II levels. (B) Representative images of HepG2 cells infected with GFP-LC3 adenovirus with or without the presence of XST-14 (5 μM) for 12 h. (C) TEM images showing the autophagic vacuoles (arrows) observed in HepG2 cells that were starved with Earle’s balanced salt solution (EBSS) for 4 h and treated with or without XST-14 (5 μM) for 12 h. The ratio of the autophagic vacuole area to the cytoplasmic area was determined by morphometric analysis. (D) The effect of XST-14 on autophagic flux. The microscopy images show red-colored autolysosomes or red/green double-colored autophagosomes. (E) XST-14 decreased the phosphorylation of BECN1 and PIK3C3. HepG2 cells were treated with XST-14 (5 μM) for 12 h, and the cell lysates were analyzed by immunoblotting. (F) XST-14 decreased the interaction between ULK1 and its downstream targets PIK3C3 and BECN1. HepG2 cells were starved with EBSS for 4 h and treated with XST-14 (5 μM) for 12 h, and the cell lysates were immunoprecipitated (IP) with anti-ULK1 and analyzed by immunoblotting with the indicated Ab. (G) XST-14 decreased the interaction of BECN1 and PIK3C3. HepG2 cells were starved with EBSS for 4 h and treated with XST-14 (5 μM) for 12 h, and the cell lysates were IP with anti-PIK3C3 and analyzed by immunoblotting with an anti-BECN1 Ab. (H) XST-14 decreased the colocalization of BECN1 (green) and PIK3C3 (red). The colocalization of BECN1 and PIK3C3 was detected in HepG2 cells (scale bar, 2 μm) with immunostaining. For panels B, C, D and H, the figures are representative of more than 10 images, and 10–20 cells were counted in each group. The data are presented as representative and/or means ± s.e.m. of three independent assays. For panels B and D, an unpaired two-sided Student’s t-test was used to compare two groups. For panels A and C, one-way ANOVA was used to compare multiple groups. ***p < 0.001.
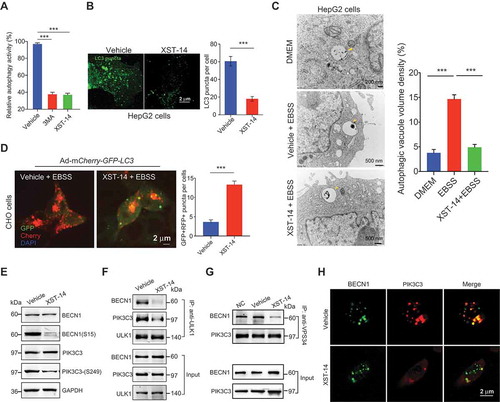
Figure 6. XST-14 acts synergistically with sorafenib to suppress HCC in vitro. (A) XST-14 inhibited HepG2 cell proliferation. HepG2 cells were treated with vehicle or the indicated concentration of XST-14 for 24 h, and cell proliferation was evaluated via EdU assays. (B, C) XST-14 inhibited the invasion of HCC cells. HepG2, Hep3B, and human primary HCC cells were treated with vehicle or XST-14 (5 μM). After treatment for 24 h, cell invasion activity was evaluated via transwell assays. (D, E) XST-14 induced HCC cell apoptosis. HepG2 and human primary cells were treated with vehicle or XST-14 (5 μM). After treatment for 24 h, apoptotic cells were evaluated via ANXA5/propidium iodide staining. (F) XST-14 inhibited sorafenib-induced autophagy in HepG2 cells. The arrows indicate Avd. The ratio of the autophagic vacuole area to the cytoplasmic area was determined by morphometric analysis. (G, H) XST-14 increased the therapeutic effects of sorafenib in vitro. HepG2 cells were treated with XST-14 (5 μM) or a combination of XST-14 (5 μM) and sorafenib (5 μM) for 24 h, and proliferation and invasion activities were evaluated via EdU (G) and transwell (H) assays. The data are presented as representative and/or means ± s.e.m. of three independent assays. For panels A, B, C, D, and E, an unpaired two-sided Student’s t-test was used to compare two groups. For panels F, G, and H, one-way ANOVA was used to compare multiple groups. *p < 0.05, **p < 0.01, ***p < 0.001.
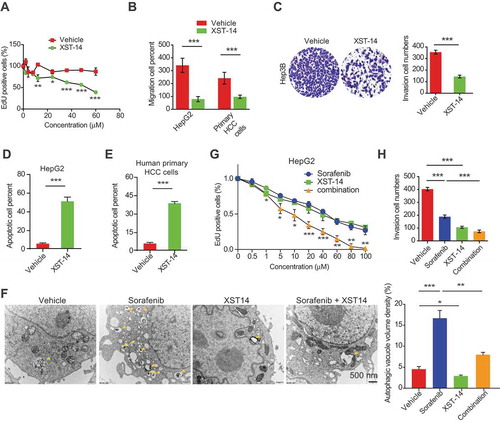
Figure 7. XST-14 acts synergistically with sorafenib to suppress HCC tumor growth. Nude mice were injected subcutaneously with HepG2 cells. When the tumor volume reached approximately 100 mm3, the mice were treated with vehicle, low-dose XST-14 (XST-14low), high-dose XST-14 (XST-14high) or a combination of sorafenib and XST-14low or XST-14high for 4 weeks. The data represent the quantified body weight (A), tumor weight (B), tumor growth curves (C), fluorescence area (D), and photographs of representative tumors (E). (F) The effects of XST-14 and/or sorafenib on the phosphorylation of BECN1, LC3-II and ULK1 in tumor tissues. Fresh tumor tissue lysates were analyzed by immunoblotting. The data are representative and/or mean ± s.e.m. (n = 10 per group). One-way ANOVA was used to compare multiple groups. *p < 0.05, ***p < 0.001.
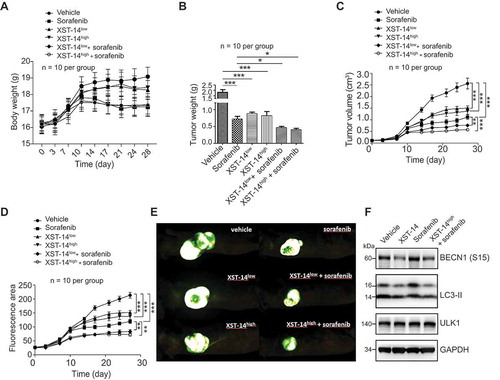
Figure 8. XST-14 exhibits favorable drug metabolism and pharmacokinetic (DMPK) properties and no obvious toxicity against liver/kidney function or body weight. (A) Chemical structure and chemical synthesis route of the XST-14 metabolite for a pharmacokinetic test calibration. (B) Rat liver microsome assay results for XST-14. Column: Kinetex-C18. Mobile phase: mobile phase A, 0.1% formic acid in water; mobile phase B, 0.1% formic acid in acetonitrile. Flow: 0.4 mL/min. Column temperature: room temperature. Injection volume: 7 μL. Run time: 4 min. (C) C57 mouse blood stability results for XST-14 and the XST-14 metabolite. Column: Kinetex-C18. Mobile phase: mobile phase A, 0.1% formic acid in water; mobile phase B, 0.1% formic acid in acetonitrile. Flow: 0.4 mL/min. Column temperature: room temperature. Injection volume: 7 μL. Run time: 4 min. (D) Summary of Sprague-Dawley rat pharmacokinetics (PK) for the XST-14 metabolite administered IV or IP. (E-H) BALB/c mice were treated with vehicle, XST-14 (30 mg/kg, IP, every other day [q.o.d.]), sorafenib (30 mg/kg, P.O., q.o.d.), or a combination of sorafenib (30 mg/kg, P.O., q.o.d.) and XST-14 (30 mg/kg, IP, q.o.d.) for 2 weeks. After the study, the mice were sacrificed, and their body weights were measured; serum was collected for biochemical assays. (E) Hematoxylin and eosin staining results for livers and kidneys (100×). (F) Serum alanine transaminase (ALT) and aspartate transaminase (AST) levels of the indicated mice were detected to evaluate liver function (n = 8 per group). (G) Serum urea and creatinine levels of the indicated mice were detected to evaluate renal function (n = 8 per group). (H) Body weights of the indicated mice were determined twice a week (n = 8 per group). One-way ANOVA was used to compare multiple groups. ***p < 0.001.
![Figure 8. XST-14 exhibits favorable drug metabolism and pharmacokinetic (DMPK) properties and no obvious toxicity against liver/kidney function or body weight. (A) Chemical structure and chemical synthesis route of the XST-14 metabolite for a pharmacokinetic test calibration. (B) Rat liver microsome assay results for XST-14. Column: Kinetex-C18. Mobile phase: mobile phase A, 0.1% formic acid in water; mobile phase B, 0.1% formic acid in acetonitrile. Flow: 0.4 mL/min. Column temperature: room temperature. Injection volume: 7 μL. Run time: 4 min. (C) C57 mouse blood stability results for XST-14 and the XST-14 metabolite. Column: Kinetex-C18. Mobile phase: mobile phase A, 0.1% formic acid in water; mobile phase B, 0.1% formic acid in acetonitrile. Flow: 0.4 mL/min. Column temperature: room temperature. Injection volume: 7 μL. Run time: 4 min. (D) Summary of Sprague-Dawley rat pharmacokinetics (PK) for the XST-14 metabolite administered IV or IP. (E-H) BALB/c mice were treated with vehicle, XST-14 (30 mg/kg, IP, every other day [q.o.d.]), sorafenib (30 mg/kg, P.O., q.o.d.), or a combination of sorafenib (30 mg/kg, P.O., q.o.d.) and XST-14 (30 mg/kg, IP, q.o.d.) for 2 weeks. After the study, the mice were sacrificed, and their body weights were measured; serum was collected for biochemical assays. (E) Hematoxylin and eosin staining results for livers and kidneys (100×). (F) Serum alanine transaminase (ALT) and aspartate transaminase (AST) levels of the indicated mice were detected to evaluate liver function (n = 8 per group). (G) Serum urea and creatinine levels of the indicated mice were detected to evaluate renal function (n = 8 per group). (H) Body weights of the indicated mice were determined twice a week (n = 8 per group). One-way ANOVA was used to compare multiple groups. ***p < 0.001.](/cms/asset/82099b9a-c93e-425f-b494-adacb73a4006/kaup_a_1709762_f0008_c.jpg)