
Figures & data
Figure 1. siRNA screens for kinases that regulate basal and etoposide-induced autophagy. (A) MCF7-RLuc-LC3 and MCF-RLuc-LC3G120A cells were treated in parallel with vehicle (DMSO), 50 µM etoposide or 10 nM rapamycin (positive control) for 15 h. Left, kinetics of autophagic flux (reduction of LC3/LC3G120A relative to T0) in one representative experiment. Right, mean ratios +SD of (LC3/LC3G120A at T15):(LC3/LC3G120A at T0) of three independent triplicate experiments. (B and C) MCF7-RLuc-LC3 and – LC3G120A cells transfected with siRNA pools targeting 710 human kinases, BECN1 siRNA (positive control) or non-targeting control siRNA (NTC) were treated in triplicate with 50 µM etoposide (B) or DMSO (C) for 15 h and analyzed for autophagic flux (reduction of LC3/LC3G120A) as outlined in the timeline (B, top). Ranking of all siRNAs (left) and siRNAs with statistically significantly stronger effect than BECN1 siRNA (right) are shown. (D) Representative immunoblots of indicated DNA damage response proteins in lysates of MCF7 cell transfected with indicated siRNAs for 75 h and treated with DMSO (-) or 50 µM etoposide (+) for the last 15 h. CDK7 served as a loading control. Values, densitometric quantifications of indicated protein/CDK7 ratios relative to control samples. <, unspecific ULK1-independent band. (E) MCF7-RLuc-LC3 and – LC3G120A cells were transfected with indicated siRNAs, treated as indicated for 15 h and analyzed for autophagic flux as in (b). Values represent means +SD of ≥ 3 independent triplicate experiments. P-values were calculated by 2-tailed, homoscedastic student’s t-test (a, c and e) or by a linear regression model and Wald test of autophagy inhibition over time (b).
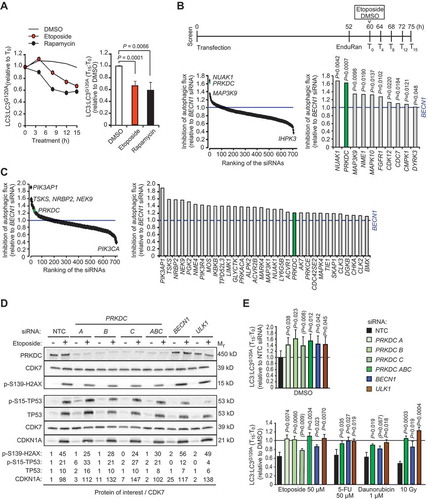
Figure 2. PRKDC depletion inhibits phagophore formation independent of MTORC1. (A) MCF7 cells transfected with indicated siRNAs for 75 h were treated with DMSO or 50 µM etoposide for the last 15 h or 10 nM rapamycin for the last 2 h. Representative confocal images of WIPI2 puncta (left), mean percentages of cells with ≥ 2 WIPI2 puncta (right, top), and immunoblots of indicated proteins (right, bottom) are shown. (B) MCF7-EGFP-LC3 cells were transfected and treated as in (a). Representative confocal images of EGFP puncta (left), mean percentages of cells with ≥ 5 EGFP-LC3 puncta (right, top), and immunoblots of indicated proteins (right, bottom) are shown. (C) MCF7-mRFP-EGFP-LC3 cells transfected with indicated siRNAs for 72 h were treated with DMSO or 50 µM etoposide for the last 15 h, or starved for glucose or treated with 100 nM rapamycin for the last 2 h. Representative confocal images (left) and quantification of initial (AVi), all (AV) and degradative (AVd) autophagic membranes (right) are show. For single-channel confocal images, see Figure S2C. Error bars, SD of ≥ 3 independent experiments with > 50 randomly chosen cells analyzed in each sample. P-values were calculated by 2-tailed, homoscedastic student’s t-test. Scale bars: 10 µm.
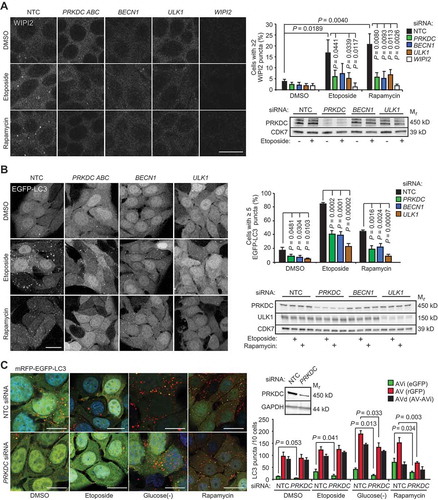
Figure 3. PRKDC regulates AMPK-ULK1 signaling pathway. (A) Representative immunoblots (left) and densitometric quantification of indicated proteins (right) in lysates of MCF7 cell transfected with indicated siRNAs for 75 h and treated with 50 µM etoposide for the 0–6 h. (B) Representative immunoblots of indicated proteins from lysates of U2OS-control and U2OS-PRKDC shRNA cells (left) and densitometric quantification of indicated phospho-protein/total protein ratios (right). (C) Immunoprecipitation (IP) of endogenous ULK1 complexes from lysates of control and PRKDC shRNA-infected U2OS cells treated with DMSO (0) or 1 µM A769662 for 1 h (1). (D) Representative immunoblots of IPs of endogenous PRKDC complexes from lysates of U2OS cells grown in complete media (0) or starved for amino acids for 2 h (2) (left) and densitometric quantification of co-precipitating PRKAA1 (right). (E) Representative immunoblots of IPs of PRKAA1 complexes from lysates of control and PRKDC shRNA-infected U2OS cells treated with DMSO (0) or 769662 for 1 h (1) (left) and densitometric quantification of co-precipitating PRKDC (right). (F) Representative confocal images of MCF7 cells grown in complete medium, starved for amino acids or treated with 100 nM NU7441 for 4 h, fixed with paraformaldehyde and stained for endogenous PRKDC (green), PRKAG1 (red) and DNA (Hoechst, blue). Yellow crosses indicate co-localization of the proteins in the cytoplasm and nucleus, respectively. Scale bar: 10 µm. Error bars, SD of ≥ 3 independent experiments. P-values were calculated by 2-tailed, homoscedastic student’s t-test.
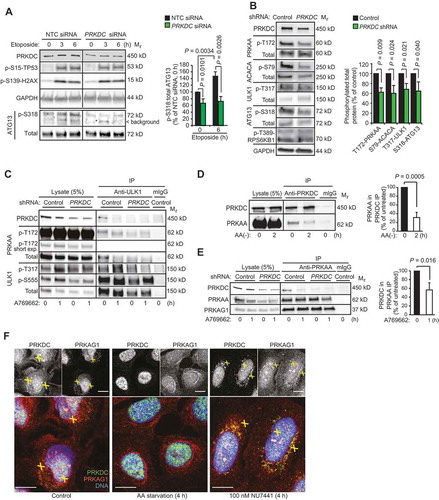
Figure 4. PRKDC phosphorylates PRKAG1. (A) In vitro PRKDC kinase assay with recombinant PRKDC (+) and PRKAG1 immunoprecipitated from MCF7 cells in stringent conditions. When indicated 100 nM NU7441 was added to the reaction. (B) Predicted PRKDC/ATM and ATM phosphorylation sites in PRKAG1. Left, crystal structure of holo-AMPK complex consisting of PRKAA1, PRKAB2 and PRKAG1 [Citation30]. Ser192 and Thr284 are highlighted with yellow. Right, domain structure of PRKAG1 with CBS domains 1–4 and predicted phosphorylation sites highlighted. (C) In vitro PRKDC kinase assay with indicated PRKAG1 peptides as substrates. Radioactivity was analyzed by FUJI phospho-imager plate and spots were quantitated with FujiFilm MultiGauge version 3.2. (D) In vitro PRKDC kinase assay with WT PRKAG1-Ch-Flag or its S192A, T284A and S192A,T284A mutants immunopurified from U2OS cells as substrates. (E) Representative immunoblots of indicated proteins from MCF7 cells transfected with non-targeting control (NTC) or PRKDC siRNA for 60 h and starved for glucose for the last 12 h when indicated (12). (F) Representative immunoblots of indicated proteins from MCF7 cells left untreated or starved for glucose for 12 h with or without 1 h recovery. When indicated cells were retreated with 100 nM NU7441 for indicated times. (G) Representative Immunoblots of indicated proteins from U2OS cells left untreated or starved for glucose for indicated times. (H) Representative immunoblots of indicated proteins from control and PRKDC shRNA-infected U2OS cells left untreated, starved for glucose or treated with 5 µM compound C as indicated. (I) Representative immunoblots of indicated proteins from MCF7 cells and BJ fibroblasts left untreated or starved for glucose for 6 h.
![Figure 4. PRKDC phosphorylates PRKAG1. (A) In vitro PRKDC kinase assay with recombinant PRKDC (+) and PRKAG1 immunoprecipitated from MCF7 cells in stringent conditions. When indicated 100 nM NU7441 was added to the reaction. (B) Predicted PRKDC/ATM and ATM phosphorylation sites in PRKAG1. Left, crystal structure of holo-AMPK complex consisting of PRKAA1, PRKAB2 and PRKAG1 [Citation30]. Ser192 and Thr284 are highlighted with yellow. Right, domain structure of PRKAG1 with CBS domains 1–4 and predicted phosphorylation sites highlighted. (C) In vitro PRKDC kinase assay with indicated PRKAG1 peptides as substrates. Radioactivity was analyzed by FUJI phospho-imager plate and spots were quantitated with FujiFilm MultiGauge version 3.2. (D) In vitro PRKDC kinase assay with WT PRKAG1-Ch-Flag or its S192A, T284A and S192A,T284A mutants immunopurified from U2OS cells as substrates. (E) Representative immunoblots of indicated proteins from MCF7 cells transfected with non-targeting control (NTC) or PRKDC siRNA for 60 h and starved for glucose for the last 12 h when indicated (12). (F) Representative immunoblots of indicated proteins from MCF7 cells left untreated or starved for glucose for 12 h with or without 1 h recovery. When indicated cells were retreated with 100 nM NU7441 for indicated times. (G) Representative Immunoblots of indicated proteins from U2OS cells left untreated or starved for glucose for indicated times. (H) Representative immunoblots of indicated proteins from control and PRKDC shRNA-infected U2OS cells left untreated, starved for glucose or treated with 5 µM compound C as indicated. (I) Representative immunoblots of indicated proteins from MCF7 cells and BJ fibroblasts left untreated or starved for glucose for 6 h.](/cms/asset/1015e476-972d-448d-a10a-0c7c023fada7/kaup_a_1710430_f0004_c.jpg)
Figure 5. PRKDC regulates PRKAG1 localization and activity. (A) Representative immunoblots of indicated proteins from COS7 cells transfected with GST- PRKAA2, PRKAB1-Flag and either WT HA-PRKAG1 or its phosphorylation-deficient Ser192 and Thr284 mutants (S192A or T284A). (B) In vitro kinase activity assay of AMPK complexes immunopurified with anti-Flag agarose gel from COS7 cells transfected as in (a) and left untreated or treated with 100 µM AMP (left). Error bars, SEM of 4 independent experiments. Right, representative immunoblots of indicated proteins from total cell lysates and anti-Flag IPs. (C) Representative images of MCF7-shPRKAG1 cells transiently transfected with WT or PRKAG1S192A,T284A-mCherry-Flag (left), and quantification of the subcellular localization of the transfected proteins (right). Values represent means +SD of three independent experiments with ≥ 50 randomly chosen cells analyzed in each sample. Crosses mark cells with nuclear/diffuse (white) and mainly cytoplasmic (green) localization of PRKAG1-mCherry-Flag. Scale bars: 10 µM. (D) IP of AMPK complexes with anti-Flag antibodies from lysates of MCF7 cells transiently transfected with either WT or PRKAG1S192A,T284A-mCherry-Flag. Left, representative immunoblots of indicated proteins in IPs and lysates. Right, quantification of co-precipitating PRKDC from three independent experiments +SD. (E) IP of AMPK complexes with anti-Flag antibodies from lysates of MCF7-shPRKAG1 and -shNTC cells transiently transfected with WT or PRKAG1S192A,T284A-mCherry-Flag. (F) LC3 puncta in MCF7-shPRKAG1 cells transiently transfected with WT or PRKAG1S192A,T284A-mCherry-Flag. Error bars, SEM of ≥ 7 samples with 10–30 cells analyzed in each. P-values were calculated by 2-tailed, homoscedastic student’s t-test.
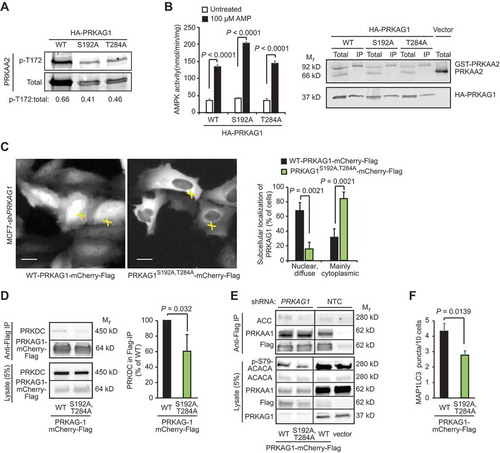
Figure 6. PRKDC regulates the lysosomal localization and STK11 association of the AMPK complex. (A) Representative laser scanning confocal images of MCF7 cells fixed with methanol and stained for PRKDC and LAMP2. A representative cross-sectional image (z: 100nm) (left) and surface-rendered de-convoluted z-stacks (middle and right) are shown. Insets show representative PRKDC- and LAMP2-positive structures marked with white arrowheads (right). Scale bars, 5 µm (white) and 1 µm (blue). (B) Percentage of PRKDC- and LAMP2-double positive structures of all LAMP2-positive structures in MCF7 cells visualized as in (a). Values represent means + SEM of 12 randomly chosen cells with a total of 1224 LAMP2-positve structures analyzed. (C) Representative immunoblots of indicated proteins from lysosomes purified from MCF7 cells starved for glucose for indicated times. When indicated (+), cells were pre-treated with 1 µM NU7441 for 16 h. (D) Representative immunoblots of indicated proteins from lysosomes and total cell lysates of MCF7 cells transiently transfected with WT PRKAG1S192A,T284A-mCherry-Flag or an empty vector (-) and starved for glucose for indicated times (left), and densitometry quantification of STK11/ATP6V0D1 and lysosomal/total PRKAG1-mCherry-Flag ratios in lysosome samples (right). Error bars, SD of ≥ 3 independent experiments. (E) IP of AMPK complexes with anti-Flag antibodies from lysates of MCF7 cells transiently transfected with either WT or PRKAG1S192A,T284A-mCherry-Flag and starved for glucose for indicated times (left), and densitometric quantification of STK11 in anti-Flag IPs (right). Error bars, SD of ≥ 3 independent experiments. P-values were calculated by 2-tailed, homoscedastic student’s t-test.
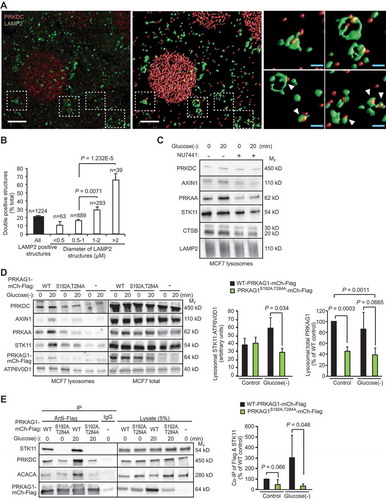
Table 1. Key Resources.