
Figures & data
Figure 1. Functional differentiation of HC11 mouse mammary epithelial cells (MECs). (A) Differentiation-dependent expression of Csn2 in HC11 cells (n = 3). (B) Expression of differentiation and cell death markers during HC11 differentiation. Levels of PARP1, c-PARP1, p-STAT3, and STAT3 are indicated below each lane after normalization to ACTB. The undifferentiated sample was set to 1.00, and all other time points are presented relative to 1.00. (C) Seahorse Extracellular Flux oxygen consumption rates (OCRs) in differentiating HC11 cells. (D) Basal OCRs and (E) maximal OCRs show progressive metabolic transition that regresses at 72 h and 96 h. (F) Energy phenotype comparison of OCRs and extracellular acidification rates (ECARs) in differentiating HC11 cells further demonstrating a dynamic metabolic transition. (n = 4, 9 replicates per experiment) U: undifferentiated; P: 24 h primed; h: hours differentiated; oligo: oligomycin; A + R: antimycin a + rotenone. Data are presented as mean ± standard deviation. Box and whisker plots are presented from the 25th to 75th percentile, with the line at the median and the whiskers extending to the minimum and maximum values. Statistical significance was evaluated with multiple student t-tests relative to the undifferentiated time point (U). *p < 0.05, **p < 0.01
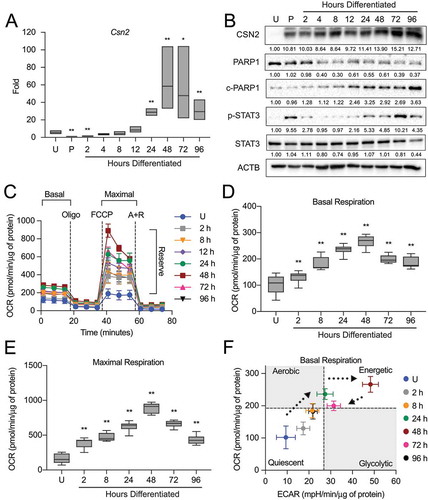
Figure 2. Autophagic membrane formation during HC11 cell differentiation. (A) Model of autophagic flux. (B) Transmission electron microscopy (TEM) images of HC11 cells at progressive stages of differentiation, showing the accumulation of autophagic membranes. (C) Higher magnification TEM images demonstrate vesicle content at each stage of differentiation. Three sections each were evaluated from two independent samples for TEM analysis. (D) LC3B levels across differentiation in HC11 cells. Levels of LC3B-I and -II are indicated below each lane after normalization to ACTB. The undifferentiated time point was set to 1.00, and all other time points are presented relative to 1.00. (E) LC3B accumulation after treatment with 100 nM bafilomycin A1 (BAF) for 4 h to prevent phagophore degradation. The level of LC3B-II was normalized to ACTB and is indicated below the blot relative to the undifferentiated and untreated time point. U: undifferentiated; P: 24 h primed; h: hours differentiated. Scale bars: 1 μm
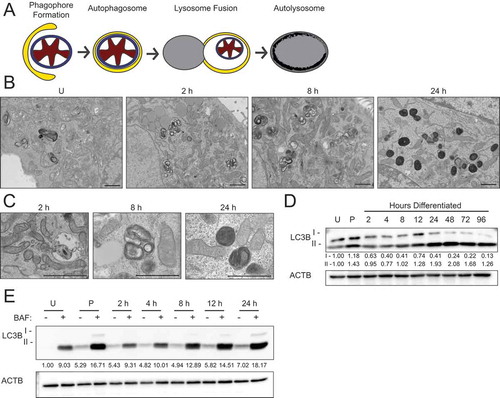
Figure 3. Transition from gestation to lactation in the mouse mammary gland. (A) Transmission electron microscopy (TEM) images of mouse mammary glands at pregnancy day 16 (P16), pregnancy day 18 (P18), and lactation day 1 (L1). Boxed regions are shown below at higher magnification. Scale bars: 1 μm. Three sections from three independent mice were evaluated by TEM. (B) Immunohistochemical staining for sequestosome 1 (SQSTM1) at P16, L1, and L10. Scale bars: 100 μm. Two mice were evaluated for each time point, and two sections from each mouse were stained for comparisons
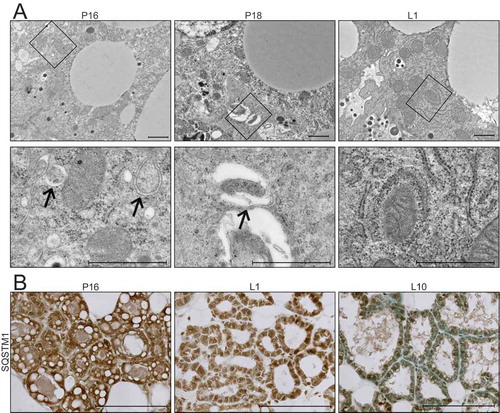
Figure 4. Inhibition of autophagy impairs HC11 cell differentiation. (A) Differentiation-dependent Csn2 expression in HC11 cells at 48 h of differentiation is inhibited by treatment with bafilomycin A1 (BAF) at low concentrations. BAF treatment was applied in the priming medium and maintained throughout differentiation (n = 3). (B) CASP3 activity in DMSO- or BAF-treated HC11 cells at 48 h of differentiation. BAF treatment was applied in the priming medium and maintained throughout differentiation (n = 3). (C) OCRs of DMSO- or BAF-treated differentiating HC11 cells. BAF treatment was applied in the priming medium and maintained throughout differentiation. (D) Basal OCRs and (E) maximal OCRs are impaired by BAF treatment at 24 and 48 h of differentiation. (F) Energy phenotypes of BAF-treated cells are also reduced compared to DMSO-treated HC11 cells (n = 2, 9 replicates per experiment). U: undifferentiated; P: 24 h primed; h: hours differentiated; oligo: oligomycin; A + R: antimycin a + rotenone. Data are presented as mean ± standard deviation. Box and whisker plots are presented from the 25th to 75th percentile, with the line at the median and the whiskers extending to the minimum and maximum values. Statistical significance was evaluated with student t-tests and compared to the appropriate DMSO-treated control. *p < 0.05, **p < 0.01
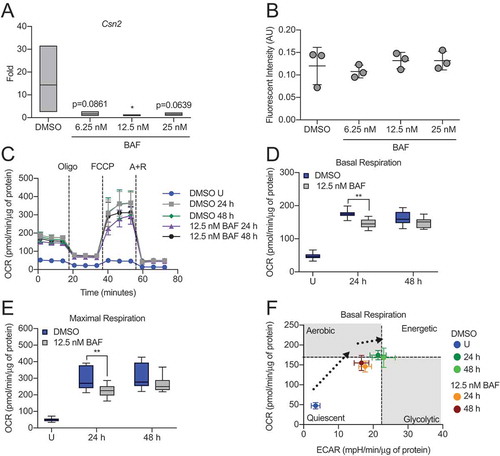
Figure 5. Expression of autophagy factors during HC11 cell differentiation and mammary gland development. (A) Atg5 and Atg7 expression across differentiation in HC11 cells and (B) at pregnancy days 16 and 18 (P16, P18) and lactation days 1 and 2 (L1, L2) in the mouse mammary gland. RNA was collected from three mice per developmental time point. (C) Expression levels of ATG5 and ATG7 across differentiation in HC11 cells. Levels of ATG5 and ATG7 are indicated below each lane after normalization to ACTB. The undifferentiated time point was set to 1.00, and all other time points are presented relative to 1.00. (D) ATG5 and ATG7 expression at P16, L1, and L7 in the mouse mammary gland. Two mice were evaluated for each time point, and two sections from each mouse were stained for comparisons. U: undifferentiated; P: 24 h primed; h: hours differentiated. Scale bars: 100 μm. Data are presented as mean ± standard deviation. Statistical significance was evaluated with multiple student t-tests relative to the undifferentiated time point (U). *p < 0.05, **p < 0.01
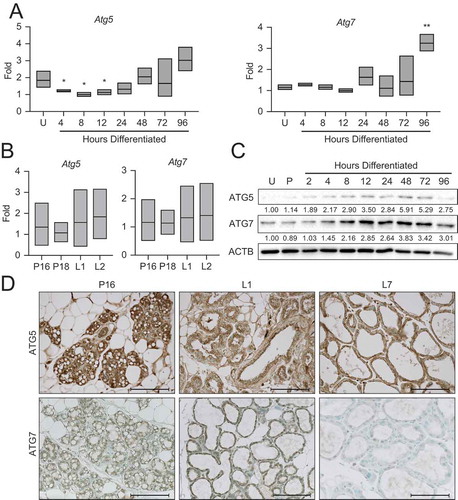
Figure 6. Knockdown of Atg7 contributes to ROS-mediated gene expression. (A) Differentiation-dependent expression of Csn2 in control (shNT) and shAtg7 HC11 cell lines (n = 3). (B) ATG7 expression in shNT and shAtg7 cell lines after 4 h treatment with DMSO, 100 nM BAF, or 1 µM FCCP (C, B, or F, respectively). Levels of ATG7 are indicated below each lane after normalization to ACTB. The shNT sample treated with BAF was set to 1.00, and all other time points are presented relative to 1.00. (C) Activation (phosphorylation) of STAT5 during differentiation in shNT and shAtg7 cell lines. Levels of p-STAT5 and STAT5 are indicated below each lane after normalization to ACTB. The undifferentiated time point was set to 1.00, and all other time points are presented relative to 1.00. (D) Mitochondrial ROS generation in shNT and shAtg7 cell lines at 48 h of differentiation, measured by mitoSOX fluorescence. Control cells were treated with DMSO or 100 nM BAF beginning at priming, and treatment was maintained through differentiation. Cells were treated with 50 µM antimycin a (AA) for 1 h prior to analysis as a positive control (n = 3). (E) MitoSOX fluorescence analysis in wild-type HC11 cells across differentiation (n = 3). (F) Reduction of differentiation-dependent Csn2 expression at 48 h in HC11 cells treated with mitochondrial ROS scavenger, mitoquinol (mitoQ, 1 μM) from priming through 48 h differentiation (n = 3). (G) Proposed model, demonstrating how loss of ATG7 contributes to STAT5-mediated differentiation-dependent gene expression. U: undifferentiated; P: 24 h primed; h: hours differentiated. Data are presented as mean ± standard deviation. Statistical significance was evaluated with multiple student t-tests relative to the undifferentiated or untreated time point. *p < 0.05, **p < 0.01
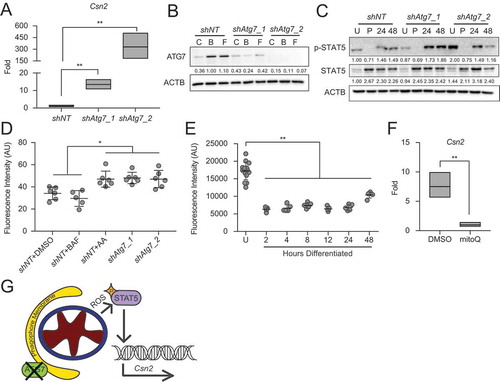
Figure 7. Metabolic transition of differentiating HC11 cells is impaired by loss of Atg7. (A) Basal OCRs and (B) maximal OCRs in shNT and shAtg7_2 HC11 cell lines. (C) Energy phenotypes in shNT and shAtg7_2 HC11 cell lines (n = 2, 9 replicates per experiment). U: undifferentiated; h: hours differentiated. Data are presented as mean ± standard deviation. Box and whisker plots are presented from the 25th to 75th percentile, with the line at the median and the whiskers extending to the minimum and maximum values. Statistical significance was evaluated with student t-tests relative to the shNT cell line. * p < 0.05, ** p < 0.01
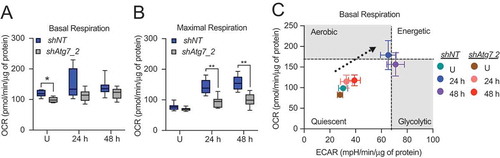
Figure 8. Mitochondria undergo progressive oxidation during HC11 cell differentiation. (A) Representative live-cell images of differentiating HC11 cells transiently transfected with pMitoTimer. Scale bars: 10 μm. (B) Average red to green fluorescent intensity ratio from 10 images per time point. (C) Enumeration of red-only punctate mitochondria from pMitoTimer images, indicating mitochondria actively undergoing mitophagy. A minimum of 10 images were evaluated per time point. Red puncta were not evaluated at 6 h of differentiation, as they were assessed from an independent experiment (n = 3). P: 24 h primed; h: hours differentiated. Data are presented as mean ± standard deviation. Box and whisker plots are presented from the 25th to 75th percentile, with the line at the median and the whiskers extending to the minimum and maximum values. Statistical significance was evaluated with multiple student t-tests relative to the primed time point (P). *p < 0.05, **p < 0.01
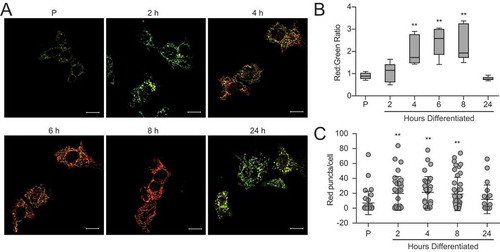
Figure 9. Pink1 and parkin expression during HC11 cell differentiation and mammary gland development. (A) Expression of Prkn across differentiation in HC11 cells (n = 3). (B) Protein levels of PRKN and PINK1 during HC11 cell differentiation. Levels of PRKN and PINK1 are indicated below each lane after normalization to GAPDH. The undifferentiated sample was set to 1.00, and all other time points are presented relative to 1.00. (C) Immunohistochemical expression of PRKN and PINK1 at pregnancy day 16 (P16), lactation day 1 (L1), and lactation day 7 (L7) in the mouse mammary gland. (D) Higher magnification of cytoplasmic PRKN staining at L1. Two mice were evaluated for each time point, and two sections from each mouse were stained for comparisons. (E) Fractionation of HC11 cell lysates into mitochondrial and cytosolic components and expression of PRKN and PINK1. VDAC1 and TUBA1A expression confirm mitochondrial and cytosolic fraction purity, respectively. Levels of PRKN and PINK1 are indicated below each lane after normalization to VDAC1 for mitochondrial fractions and to TUBA1A for cytosolic fractions. The undifferentiated sample for each fraction was set to 1.00, and all other time points are presented relative to 1.00. (F) JC-1 was used to assess mitochondrial membrane polarization. A minimum of 10 images were evaluated for red and green fluorescent intensity for each time point. FCCP was used as a positive control for membrane depolarization (n = 3). U: undifferentiated; UC: undifferentiated confluent; P: 24 h primed; h: hours differentiated Scale bars: 100 μm. Data are presented as mean ± standard deviation. Statistical significance was evaluated with multiple student t-tests relative to the undifferentiated time point (U). **p < 0.01
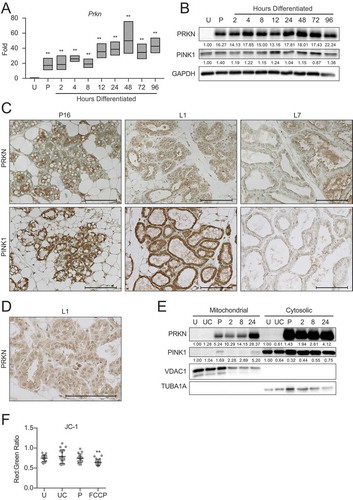
Figure 10. Loss of Prkn impairs HC11 cell differentiation. (A) PRKN expression in shNT and shPrkn HC11 cell lines at 24 h of priming. Levels of PRKN are indicated below each lane after normalization to ACTB. The shNT sample was set to 1.00, and all other time points are presented relative to 1.00. (B) CASP3 activity in shNT and shPrkn HC11 cell lines at 24 h priming, showing induction of caspase activity in the shPrkn_1 cell line (n = 3). (C) CASP3 activity in shNT and shPrkn_2 cell lines at 24 h of differentiation (n = 3). (D) Basal OCRs in proliferating shNT and shPrkn HC11 cell lines. (E) Basal OCRs in shNT and shPrkn HC11 cell lines at a proliferative (U) state and at 24 h of differentiation. (F) Breakdown of basal and (G) maximal respiration in shNT and shPrkn HC11 cell lines at a proliferative (U) state and at 24 h of differentiation. (H) Energy phenotype profile of basal state shNT and shPrkn HC11 cell lines (n = 2, 9 replicates per experiment). (I) Differentiation-dependent Csn2 expression after loss of Prkn in HC11 cells at 24 h of differentiation (n = 3). Data are presented as mean ± standard deviation. Box and whisker plots are presented from the 25th to 75th percentile, with the line at the median and the whiskers extending to the minimum and maximum values. Statistical significance was evaluated with student t-tests relative to the shNT cell line. **p < 0.01
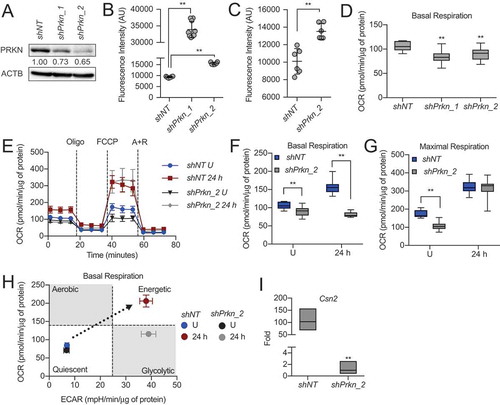
Figure 11. Model of MEC functional differentiation. Our results suggest that the transition from gestation to lactation in the mammary gland involves programmed mitophagy. This process relies on the autophagy machinery as well as the mitophagy factor PRKN. The boxes depict the outcomes of Atg7 knockdown, Prkn knockdown, and pharmacological inhibition of autophagy with bafilomycin A1 (BAF). Notably, this form of mitophagy is distinct from the general autophagy that occurs during involution to reset the mammary gland for subsequent rounds of gestation and lactation
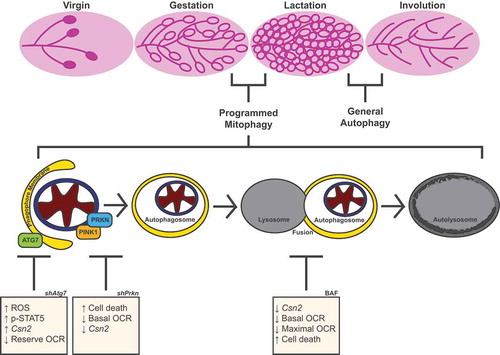
Table 1. Primer list
Table 2. Antibody list