3,970
Views
36
CrossRef citations to date
0
Altmetric
Commentary and Views

Photodynamic therapy: autophagy and mitophagy, apoptosis and paraptosis

ORCID Icon &
Pages 2098-2101 | Received 02 Mar 2020, Accepted 20 May 2020, Published online: 25 Jun 2020

Figures & data

Figure 1. Dose-response data from experiments involving 1c1c7 murine hepatoma cells. (A) Response to photokilling (BPD) targeting mitochondria + ER. (B) Response to photokilling that targets lysosomes (NPe6): wild type (●), ATG5 KD (○), ATG7 KD (▲). (Adapted from Refs. 2 and 3). Data represent clonogenic survival normalized to the plating efficiency of controls
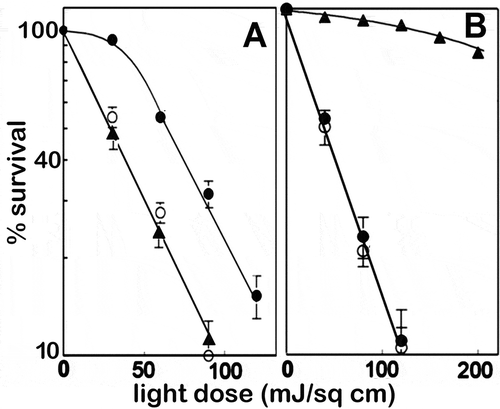
Figure 1. Dose-response data from experiments involving 1c1c7 murine hepatoma cells. (A) Response to photokilling (BPD) targeting mitochondria + ER. (B) Response to photokilling that targets lysosomes (NPe6): wild type (●), ATG5 KD (○), ATG7 KD (▲). (Adapted from Refs. 2 and 3). Data represent clonogenic survival normalized to the plating efficiency of controls

Reprints and Corporate Permissions

Please note: Selecting permissions does not provide access to the full text of the article, please see our help page How do I view content?

To request a reprint or corporate permissions for this article, please click on the relevant link below:

Academic Permissions

Please note: Selecting permissions does not provide access to the full text of the article, please see our help page How do I view content?

Obtain permissions instantly via Rightslink by clicking on the button below:

If you are unable to obtain permissions via Rightslink, please complete and submit this Permissions form. For more information, please visit our Permissions help page.