Figures & data
Figure 1. DNA damage and oxidative stress induce eMI in the larval fat body. (A, B) Compared to untreated control (A), treatment of larvae with the DNA damaging agent Eto for 25 h robustly induces eMI puncta. (C, D) Oxidative stress induced by paraquat induces eMI. (C) Untreated control, (D) fat body of paraquat-treated larvae. eMI sensor is shown in red, (endo)lysosomes in green, nuclei are in blue. A’-D’ and A” to D”: single-channel image of indicated channels. Scale bar: 20 µm. (E) Quantification of eMI puncta per cell at indicated time points. Grey: untreated, blue: paraquat-, and magenta: Eto-treated. (F) Quantification of eMI puncta upon treatment with 50 µM doxorubicin (magenta). (G) Quantification of eMI puncta upon treatment with indicated concentrations of menadione bisulfite (blue). E: One-way ANOVA (Dunnett corrections) p < 0.05; F: Unpaired T-test ****, P < 0.0001. G: One-way ANOVA (Tukey corrections) p < 0.0001. *, P < 0.05; **, P < 0.01, ****, P < 0.0001. Unpaired T-test results are indicated as “t-values”
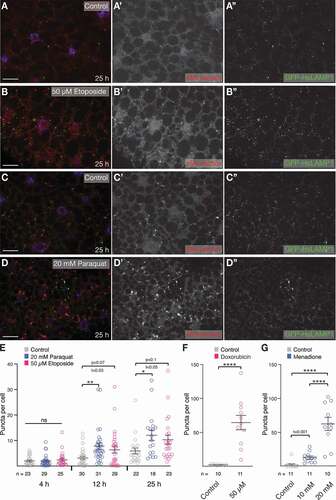
Figure 2. ER stress does not elicit an eMI response. (A-C) Compared to control (A, A’), treatment of larvae with 1 µM thapsigargin (B, B’) or 50 µg/ml tunicamycin (C, C’) does not cause the formation of sensor puncta in the fat body. (Endo)lysosomes are marked using GFP-hsLAMP1. Monochrome images show indicated channels. Nuclei are in blue. (D, E) Quantification of a dose-response curve of treatment with thapsigargin (D) and tunicamycin (E). One-way ANOVA (Dunnett corrections): ns: not significant. (F-I) At indicated concentrations thapsigargin (G) and (H) tunicamycin induce ER stress reflected by nuclear GFP signal of the Xbp1 sensor. (I) Percentage of nuclei with GFP of indicated samples; Fisher’s exact test (Bonferroni correction); ****, P < 0.0001. n: fields of view (fat body lobes), except in (I), where it reflects total number of cells. Scale bars: 20 µm
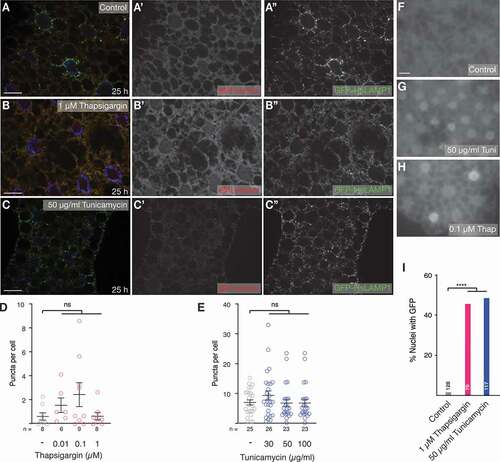
Figure 3. eMI sensor puncta formation requires ESCRTs cell-autonomously. Fat body cells lacking GFP (outlined in yellow in A’-D’) are homozygous mutant for the ESCRT II component Vps25 (A, B) and the ESCRT III component shrb (C, D) and fail to elicit an eMI response (red in composite image; compare with heterozygous or homozygous wildtype, GFP-positive cells). (A, B) 50 µM Eto treatment for 25 h. (C, D) 20 mM paraquat treatment for 25 h. Nuclei are in blue in merged images. A’- D’ and A”- D” are monochrome images of the indicated channels. Scale Bar: 20 µm
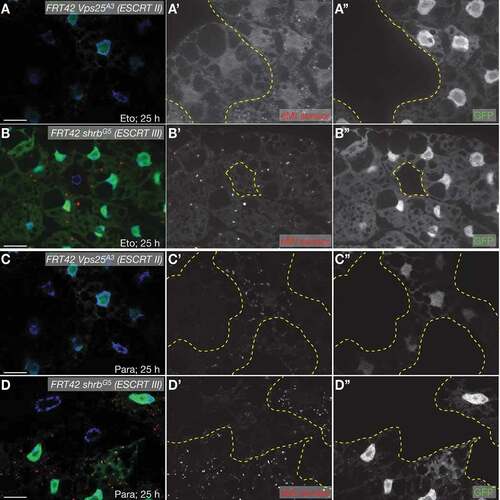
Figure 4. DNA damage and ROS induced eMI is in part a bulk process. (A, B) Eto-treated (A) or paraquat-treated (B) Hsc70-4Δ16 homozygous mutant cells (lacking GFP expression; outlined in yellow in A’, B’) show a partially reduced eMI response (red) compared to neighboring cells. Nuclei are in blue in merged images. Monochrome images show indicated channel. Scale bar: 20 µm. (C, D) Quantification of eMI response in fat body cells treated with Eto (C) or paraquat (D) expressing indicated knockdown constructs. One-way ANOVA (Dunnett corrections) p < 0.001; ***, P < 0.001. (E) Compared to the WT sensor, a sensor in which the KFERQ motif was mutated to KFEAA (AA) does not show a significant puncta formation. One-way ANOVA (Tukey corrections) p < 0.05; *, P < 0.05. ns: not significant
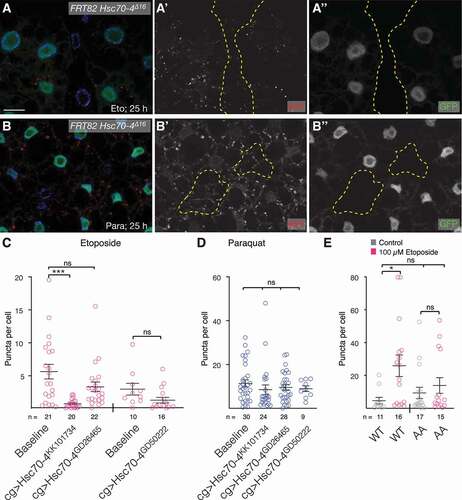
Figure 5. eMI compensates for lack of MA. (A-D) Compared to untreated fat body cells (A) and Eto treatment alone (B), RNAi mediated knockdown of Atg7 with indicated RNAi lines (C, D) leads to an enhanced eMI response (red; (endo)lysosomes marked by GFP-HsLAMP1 in green, nuclei in blue). Monochrome images show indicated channels. (E, F) Quantification of the eMI response in indicated genotypes upon treatment with Eto (E) and paraquat (F). One-way ANOVAs (Tukey correction; (E) p < 0.001; (F) p < 0.0001). *, P < 0.05; **, P < 0.01; ***, P < 0.001; ****, P < 0.0001. Unpaired T-test results are indicated as “t-values”
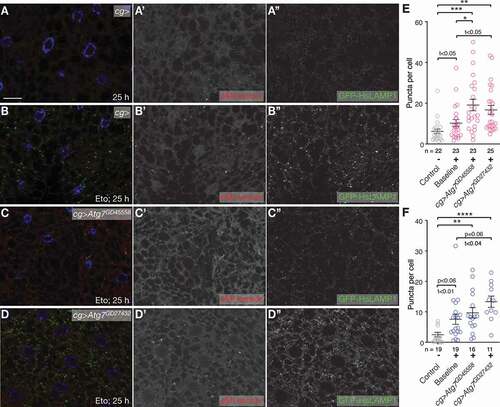
Figure 6. Loss of components of the ATM and ATR pathways induces eMI. (A, C, E, G, I) Untreated fat body. Compared to w- control (A), tefuatm−8 (C), mei-41atr−29D (E), and grpchk1-fs1 (I) mutants show increased eMI activity (red). lokchk2-P6 (G) may show a tendency toward increased sensor signal. (B, D, F, H, J) Eto-treated larvae. Compared to w− control-treated larvae (B), atm/tefu-8 (D) larvae show an enhanced eMI response, while mei-41atr−29D (F), lokchk2-P6 (H), and grpchk1-fs1 (J) mutants show no significant change. Nuclei are in blue, monochrome images show eMI. Scale bar: 20 µm. (K-N) Quantification of eMI response in untreated (gray) and Eto-treated larvae (magenta) of indicated genotypes. Note that mei-41atr−29D and grpchk1-fs1 heterozygotes also show a phenotype in the absence of drug. (K, M) t-tests. (L, N) One-way ANOVAs (Dunnett corrections): p < 0.0001 (L); p < 0.001 (N). *, P < 0.05; **, P < 0.01; ***, P < 0.001
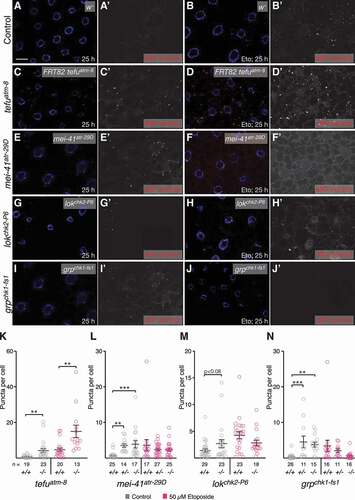
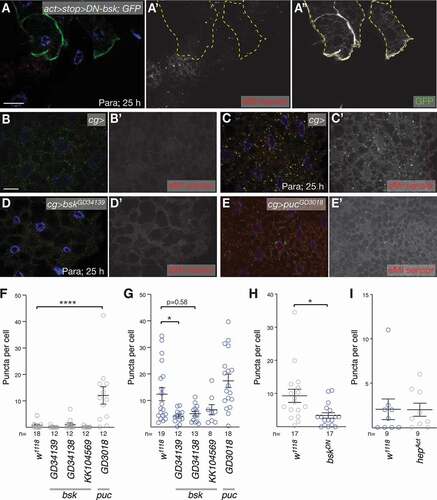
Figure 7. JNK signaling regulates ROS induced eMI. (A) Expression of DN-Bsk marked by co-expression of GFP (A”) cell-autonomously blocks eMI (A’) induced by paraquat. (B-D) Compared to paraquat-treated control larvae that show an eMI response (C; untreated control in B), knockdown of bsk leads to a reduction of eMI (D). (E) In contrast, knockdown of the JNK feedback inhibitor puc with RNAi lines GD3018 is sufficient to induce an eMI response in the absence of drug. (F-G) Quantification of the eMI response of controls and indicated RNAi knockdowns for untreated (F), paraquat-treated (G) larvae. (H) Quantification of eMI response comparing control with neighboring DN-Bsk expressing fat body cells. (I) Quantification of eMI response upon expression of hepAct. Single-channel images show grayscale image of indicated channels. In composite images, nuclei are in blue. Scale bars: 20 µm. (F,G) One-way ANOVAs (Dunnett corrections) with p < 0.0001 (F) and p < 0.001 (G), respectively. (H,I) t-tests. *, P < 0.05; ****, P < 0.0001