Figures & data
Figure 1. CAV1 is released in a novel form from LNCaP cells. (A) Western blots of PC3 cells P100 fractions demonstrating the ultracentrigation purification method used in this study is not contaminated with subcellular protein markers. Cells were incubated in serum free medium (SFM) for 16 h prior to the ultracentrigation. EEA1 (early endosome antigen 1), STX6 (syntaxin 6), GOLGA2, NUP62 and phosphoinositide 3-kinase (PI3K) were absent from the P100 fraction in PC3 cells. Protein markers of exosomes including FLOT1, ACTB/β-actin and TUBA/α-tubulin were detected by western blot. (B) Western blot analysis and quantification of released CAV1 in P100 and S100 fractions were performed after PC3 cells were serum starved for 16 h. CD63 and CAV1 were enriched in the P100 fraction whereas CAV1 was absent from the S100 fraction. (C) Western blot and quantification of the release of CAV1 from LNCaP cells transiently expressing CAV1 after 16-h serum starvation. A proportion of CAV1 is observed in both the P100 and S100 fractions after ultracentifugation. (D) Western blot of sucrose gradients from 0 M to 2 M of P100 fractions from PC3 cells serum-starved for 16 h showing CAV1 fractionates at higher densities and co-fractionates with exosomal protein markers. (E) EM of sucrose gradient fractions stained with 0.4% uranyl acetate mounted in 2% methyl cellulose. Peak exosomal morphology correlated with peak CAV1 protein levels. Left panel: fraction 7, right panel: fraction 8. Scale bars: 200 nm. (F) Sucrose gradients of P100 and S100 fractions isolated from LNCaP cells starved for 48 h demonstrating CAV1 is highly abundant in the S100 fraction consistently and fractionates at lower densities compared to CAV1 present in the P100 fraction and CAV1 secreted from PC3 cells. All western blots are representative blots chosen from three independent replicates
Figure 2. LNCaP cells release CAV1 in an antibody-accessible form. (A) Western blot of an immunoprecipitation of CAV1 from the S100 fraction of LNCaP cells with 48-h serum starvation with an α-CAV1 antibody demonstrating CAV1 can be immunoisolated in the absence of detergent. (B-D) CAV1 in the S100 fraction from LNCaP cells with 24-h serum starvation can be pulled down by anti-CAV1 antibodies and GFP-trap binding to fusion tags at both the N- and C-termini of CAV1 without detergent treatment. No tagged CAV1 was used as a negative control for GFP-trap in Figure 2D. (E) Immunoprecipitation of culture medium from 16-h serum-starved PC3 cells with an α-CD63 antibody results in the pulldown of CAV1 in the absence of detergent whereas immunoprecipitation with an anti-CAV1 antibody does not result in the isolation of CAV1 unless pre-treated with a detergent. (F) Western blot demonstrating pulldown of CAV1 from the P100 fraction of PC3 cells with 16-h serum starvation is dependent on detergent treatment. All western blots are representative blots chosen from three independent replicates
Figure 3. Regulated release of CAV1 from LNCaP cells. (A) Western blot of CAV1 release from LNCaP cells stimulated with ionomycin. Cells were treated with 500 nM ionomycin in serum free media for various times (0 to 4 h). (B) Peak release of CAV1 was observed after 1 h of treatment. Preferential release of CAV1 in the S100 fraction (compared to the P100 fraction) was observed and did not correlate with the release of LDH. A similar stimulation was observed for PC3 cells (see Fig. S5 A and B). (C) LNCaP cells expressing GFP-RAB5Q79L; CAV1 is sorted into RAB5-positive endosomes in the absence of CAVIN1 expression, scale bar: 10 μm. (D) CAVIN1 expression sequesters and stabilizes CAV1 at the PM within caveolae, scale bar: 10 τm. (E) Western blots of CAV1 levels in the P100 and S100 fractions with or without CAVIN1-GFP expression in LNCaP cells following 16-h serum starvation. (F) Quantification of western blots of the P100 and S100 fractions of CAVIN1 expressing LNCaP cells compared to GFP expression alone. CAVIN1 resulted in a reduction in CAV1 release in both fractions without altering LDH levels. n = 4; error bars represent SEM. We also confirmed that CAVIN1 expression in PC3 cells (also devoid of CAVIN1 expression [Citation6]) reduced internalization and secretion of CAV1 (see Fig. S3). (G) Quantification of CAV1-positive GFP-RAB5Q79L endosomes demonstrates the expression of CAVIN1 significantly reduced the internal pool of CAV1. Statistical significance was determined by two-tailed t tests; p = 0.0011, n = 3, error bars represent SEM
![Figure 3. Regulated release of CAV1 from LNCaP cells. (A) Western blot of CAV1 release from LNCaP cells stimulated with ionomycin. Cells were treated with 500 nM ionomycin in serum free media for various times (0 to 4 h). (B) Peak release of CAV1 was observed after 1 h of treatment. Preferential release of CAV1 in the S100 fraction (compared to the P100 fraction) was observed and did not correlate with the release of LDH. A similar stimulation was observed for PC3 cells (see Fig. S5 A and B). (C) LNCaP cells expressing GFP-RAB5Q79L; CAV1 is sorted into RAB5-positive endosomes in the absence of CAVIN1 expression, scale bar: 10 μm. (D) CAVIN1 expression sequesters and stabilizes CAV1 at the PM within caveolae, scale bar: 10 τm. (E) Western blots of CAV1 levels in the P100 and S100 fractions with or without CAVIN1-GFP expression in LNCaP cells following 16-h serum starvation. (F) Quantification of western blots of the P100 and S100 fractions of CAVIN1 expressing LNCaP cells compared to GFP expression alone. CAVIN1 resulted in a reduction in CAV1 release in both fractions without altering LDH levels. n = 4; error bars represent SEM. We also confirmed that CAVIN1 expression in PC3 cells (also devoid of CAVIN1 expression [Citation6]) reduced internalization and secretion of CAV1 (see Fig. S3). (G) Quantification of CAV1-positive GFP-RAB5Q79L endosomes demonstrates the expression of CAVIN1 significantly reduced the internal pool of CAV1. Statistical significance was determined by two-tailed t tests; p = 0.0011, n = 3, error bars represent SEM](/cms/asset/c1fbc2bc-9d1f-4404-abf9-6cef7a76960a/kaup_a_1820787_f0003_oc.jpg)
Figure 4. High-resolution analyses of C-exosomes and YFP-CAV1 in LNCaP cells. (A) EM of YFP-CAV1 isolated from LNCaP media demonstrates particles are regularly shaped vesicles. Inset shows high-magnification image of stained LNCaP particles with a prominent coat on the external leaflet, which includes the YFP fusion and GFP-trap with a maltose binding protein tag. Scale bar: 500 nm. (B-D) Single molecule analysis of YFP-CAV1 released from LNCaP cells. (B) Control analysis of YFP alone demonstrates a residence time of approximately 95 μsec. (C) Analysis of the residence time of YFP-CAV1 demonstrates a 7.5-fold increase in the residence time compared to YFP alone. (D) Plot of burst brightness against the number of bursts of that brightness demonstrates the maximum number of YFP-CAV1 molecules per vesicle to range between 50–60 proteins. (E-I) EM analyses of YFP distribution in cells using APEX-GBP expressing YFP-tagged constructs. (E) Co-expression of YFP-CAV1 and APEX-GBP demonstrates morphologically typical localization of CAV1 in BHK cells at caveolae on the PM of expressing cells. Arrows denote the caveolae with enriched electron density by the association of APEX-GBP. Cav: caveolae, scale bar: 500 nm. F) The co-expression of YFP and APEX-GBP demonstrates a cytoplasmic distribution for YFP alone. Scale bar: 500 nm. G) Lower magnification image of an LNCaP cell transfected with APEX-GBP and YFP-CAV1. Arrowheads highlight small vesicles with very strong reaction products that were absent from BHK cells. PM: plasma membrane, M: mitochondria, En: endosome. H) Small YFP-CAV1 enriched vesicle surrounded by ER. Scale bar: 100 nm. I) High-magnification image of an YFP-CAV1 shows vesicles are membrane bound. Scale bar: 100 nm. J) LNCaP cell expressing YFP-CAV1 and APEX-GBP serum starved to increase basal autophagy prior to fixation. High magnification image showing an autophagosome (AP) completely engulfing a YFP-CAV1 positive vesicle (arrow). Scale bar: 200 nm Electron micrographs are representative images; each LNCaP experiment was independently replicated three times

Figure 5. CAV1 expression in PC3 results in predominantly endosomal localization by APEX-GBP and EM. EM analysis of YFP distribution in cells using APEX-GBP expressing YFP-tagged constructs. (A) The co-expression of YFP and APEX-GBP results in soluble reaction product localized to the cytoplasm of transfected cells. Asterisk denotes the electron density of an untransfected adjacent cell, PM = plasma membrane, M = mitochondria, scale bar: 500 nm. (B) Electron micrograph of a PC3 cell co-transfected with YFP-CAV1 and APEX-GBP. Electron density shows significant enrichment of CAV1 at endosomes (white arrows), the plasma membrane (black arrow) and less frequently small vesicular structures in the cytoplasm (black arrowhead). En: endosome, PM: plasma membrane, scale bar: 500 nm. (C-E) ILVs (white arrowheads) and secreted ILVs/exosomes (red arrowheads) highly enriched with YFP-CAV1 and APEX-GBP inside endosomes and outside the cell. Scale bars: 500 nm. Electron micrographs are representative images; each PC3 experiment was independently replicated two times
Figure 6. CAV1 mutants are differentially released from LNCaP cells. (A) Western blot of the S100 and P100 fractions of CAV1 released from S80A and S80E expressing LNCaP cells with 16-h serum starvation. (B) A relative increase in the release of the S80A in both the P100 and S100 fractions was observed compared to WT (n = 3). (C) A relative reduction in the release of the S80E mutant was observed compared to WT. While LDH levels were increased with the expression of the CAV1S80E mutant, this would likely result in a corresponding increase in the nonspecific release of. Despite this, a two-fold reduction in secreted CAV1 levels were observed. (D) WT CAV1 partially co-localizes with GOLGA2 at the Golgi complex, scale bar: 10 τm. (E) The S80E mutant is almost exclusively localized to the Golgi complex, scale bar: 20 τm. (F) WT CAV1 is sorted into GFP-RAB5Q79L positive compartments, scale bar: 10 τm. (G) S80E mutant is not efficiently sorted into GFP-RAB5Q79L-positive endosomes, scale bar: 10 τm. (H) CAVIN1-Flag expression stabilizes CAV1 in punctate structures at the PM of LNCaP cells, scale bar: 10 τm. (I) CAVIN1-Flag expression does not stabilize CAV1 at the surface of LNCaP cells and CAVIN1 remains cytoplasmic/soluble when co-transfected with the S80E mutant, scale bar: 10 τm. (J) LNCaP cells demonstrating the S80A point mutant efficiently generated C-exosome precursors in the cytoplasm. C-exosomes = black arrows. Scale bar: 500 nm. (K) LNCaP cells expressing YFP-CAV1S80E mutant construct. The point mutation predominantly is localized to the Golgi complex and is inefficient in generating small CAV1-rich vesicles. Scale bar: 500 nm. Fluorescent images are representative images from three independent replicates. Electron micrographs are representative images; each LNCaP experiment was independently replicated three times
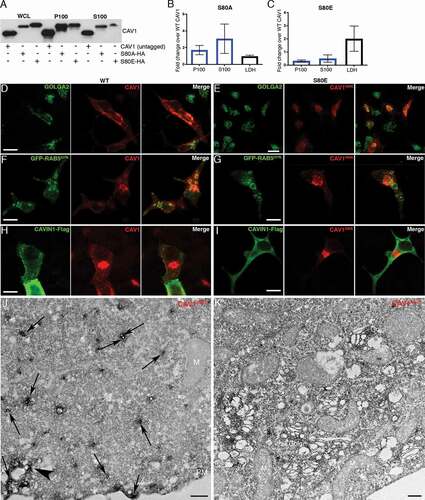
Figure 7. CAV1 secretion from LNCaP cells is mediated by an autophagy-dependent pathway. (A) Representative confocal microscopy images from three independent experiments showing co-localization between YFP-CAV1 and LC3B in LNCaP cells with or without 6-h serum starvation. Endogenous LC3B was immuno-stained with rabbit anti-LC3B primary antibodies followed by a secondary Alexa555 fluorescent labeling. Knockdown of ATG5, ATG9A or ATG12 and 3-MA (5 mM, 6 h) treatment rescued YFP-CAV1 expression and inhibited autophagosome formation. Single channel images were converted to black and white and the contrast was inverted. The enlarged region demonstrates the overlapping distribution between YFP-CAV1 and LC3B. Scale bar: 10 τm. (B) Quantification of the number of LC3B vesicles in the confocal images. One-way ANOVA was performed for statistical analysis from three experiments, n ≥ 50 cells for each experiment. (siScrambled fed vs. siScrambled starved: p = 0.0003; siATG5 starved vs. siScrambled starved: p = 0.0013; siATG9A starved vs. siScrambled starved: p = 0.0022; siATG12 starved vs. siScrambled starved: p = 0.0005; 3-MA starved vs. siScrambled starved: p = 0.0014). (C) Representative western blots showing YFP-CAV1 protein levels in WCL and S100 fractions of LNCaP cells equivalently transfected with YFP-CAV1 (10 τg DNA per 150 × 25 mm dish). The knockdown efficiency was assessed by the detection of ATG5, ATG9A and ATG12 protein levels. (D) The ratio of LC3B-II:LC3B-I (LC3B-II:I) was calculated as an indicator of autophagic levels in each group. A significant increase in the LC3B-II:I ratio of the serum-starved siScrambled cells (2.8) compared to the fed siScrambled cells (1.3) indicates the induction of autophagy. One-way ANOVA was performed for statistical analysis from three experiments. (siScrambled fed vs. siScrambled starved: p = 0.0262; siATG5 starved vs. siScrambled starved: p = 0.0307; siATG9A starved vs. siScrambled starved: p = 0.0497; siATG12 starved vs. siScrambled starved: p = 0.0223; 3-MA starved vs. siScrambled starved: p = 0.0137). (E) Densitometry analysis of western blots shown in (D) demonstrate that the co-transfection with ATG5, ATG9A or ATG12 siRNAs and 3-MA treatment significantly (siATG5 starved vs. siScrambled starved: p = 0.0047; siATG9A starved vs. siScrambled starved: p < 0.0001; siATG12 starved vs. siScrambled starved: p = 0.0031; 3-MA starved vs. siScrambled starved: p < 0.0001) rescued the downregulation of YFP-CAV1 (siScrambled fed vs. siScrambled starved: p = 0.0246) in the WCL of serum-starved cells compared to the fed cells. One-way ANOVA was performed for statistical analysis. (F) The secretion (%) of YFP-CAV1 into the S100 fraction from LNCaP cells was significantly upregulated (siScrambled fed vs. siScrambled starved: p = 0.0011) upon serum starvation. The blockage of serum starvation-induced autophagy via ATG5, ATG9A, ATG12 knockdowns or 3-MA treatment downregulated the secretion levels of YFP-CAV1. Statistically-significant effects (one-way ANOVA) were observed in ATG9A siRNA (siATG9A starved vs. siScrambled starved: p = 0.0152), ATG12 siRNA (siATG12 starved vs. siScrambled starved: p = 0.0056) and 3-MA (3-MA starved vs. siScrambled starved: p = 0.0007) treated groups
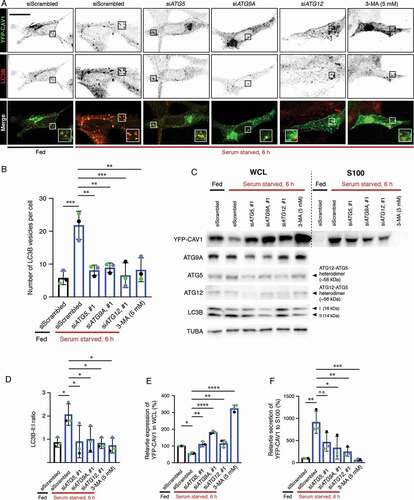
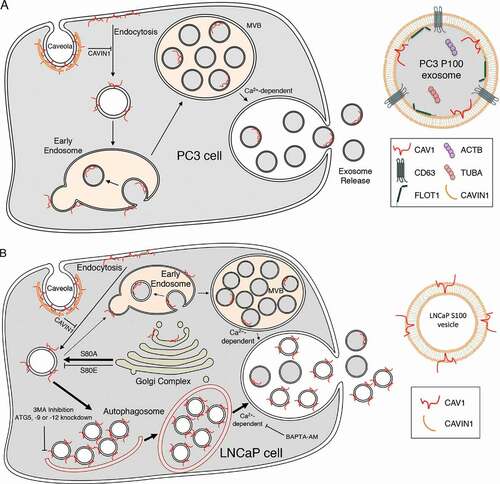
Figure 8. CAV1 secretion from PCa cells. (A) Schematic summary of the exosomal release of CAV1 from PC3 cells. (B) Schematic summary of the autophagy-based secretion of CAV1 from LNCaP cells