Figures & data
Figure 1. Upregulation of Tfg during plasma cell differentiation. (a)-(c) Published, freely available datasets from RNA-Seq data from WT mice or irf4 KO mice [Citation24,Citation56,Citation57] were assessed for abundance of Tfg mRNA in B cells subsets: pro- (proB), pre- (preB), immature (Im) and mature (Ma), B1a, FO (follicular), MZ (marginal zone), GC (germinal center) B cells, PB (plasmablasts), PC (plasma cells) and in MPC11 plasmocytoma cells where irf4 can be conditionally deleted [Citation56]. Spl, spleen; BM, bone marrow. (d) Follicular (FO), marginal zone (MZ), surface IgA- (IgA), IgM- (IgM) and double Ig-negative (DN) plasmablast/plasma cells were sorted from spleen and bone marrow of four C57/Bl6 mice. Tfg mRNA abundance relative to Actb was determined by TaqMan quantitative real-time PCR of RNA prepared from sorted cells as well as from 72 h LPS-activated splenic b cells (LPS). Means -/+ SD of three technical replicates and two biological replicates are shown
![Figure 1. Upregulation of Tfg during plasma cell differentiation. (a)-(c) Published, freely available datasets from RNA-Seq data from WT mice or irf4 KO mice [Citation24,Citation56,Citation57] were assessed for abundance of Tfg mRNA in B cells subsets: pro- (proB), pre- (preB), immature (Im) and mature (Ma), B1a, FO (follicular), MZ (marginal zone), GC (germinal center) B cells, PB (plasmablasts), PC (plasma cells) and in MPC11 plasmocytoma cells where irf4 can be conditionally deleted [Citation56]. Spl, spleen; BM, bone marrow. (d) Follicular (FO), marginal zone (MZ), surface IgA- (IgA), IgM- (IgM) and double Ig-negative (DN) plasmablast/plasma cells were sorted from spleen and bone marrow of four C57/Bl6 mice. Tfg mRNA abundance relative to Actb was determined by TaqMan quantitative real-time PCR of RNA prepared from sorted cells as well as from 72 h LPS-activated splenic b cells (LPS). Means -/+ SD of three technical replicates and two biological replicates are shown](/cms/asset/4c75ee94-1f15-497b-9a1d-b78a3eb95459/kaup_a_1821546_f0001_oc.jpg)
Figure 2. Upregulation of TFG during plasmablast differentiation. (a) Murine splenic B cells were purified and activated over the indicated time course with LPS or CpG. Protein lysates were tested for TFG, ACTB/ACTIN and Ig μ heavy chain abundance by western blotting. A representative of three independent experiments is shown, positions of molecular mass standards are indicated on the left. (b) Peritoneal B1 B cells were sorted and activated over the indicated time course with LPS or CpG. Protein lysates were tested for TFG, ACTB/ACTIN and Ig μ heavy chain abundance by western blotting. Representative of two experiments, positions of molecular mass standards are indicated on the left. (c) Quantification (mean + SD) of the experiments shown in A and B
Figure 3. TFG exerts anti-apoptotic functions in CH12 B cells. (a) Flow cytometric analysis of the DNA content of CH12 tfg WT and tfg KO B cells using propidium iodide staining (PI). Representative histogram overlay, FI: fluorescence intensity. (b) Statistical analysis of cell cycle and apoptosis of tfg WT and tfg KO CH12 B cells (7 independent clones each, two-way ANOVA with Sidak’s multiple comparisons test, *** p < 0.001, according to the gating in A. (c) Lysates of tfg WT and tfg KO CH12 B cells (clones as illustrated on the top) were analyzed for the expression of ACTA1/ACTIN, TFG and cleaved CASP3 by western blotting as indicated. Molecular mass standards (kDa) are shown on the left, (d) Quantification of cleaved CASP3 relative to ACTA1/ACTIN from the western blot shown in C. (e) tfg WT and tfg KO CH12 B cells were labeled with CFSE and analyzed after 2 d by flow cytometry. Shown is a representative histogram overlay. (f) Quantification of CFSE median fluorescence intensity over time. (g) CH12 tfg WT and tfg KO B cells (7 clones each) were infected with retroviruses encoding TFG-IRES-GFP or IRES-GFP (empty) alone. LTR: long terminal repeat. The frequency of GFP+ cells was monitored over 14 d by flow cytometry and is shown relative to day 2. Two-way ANOVA with Tukey´s multiple comparisons test, *** p < 0.001, ** p < 0.01. (h) CH12 tfg WT and tfg KO B cells (7 clones each) were infected with retroviruses encoding BCL2-IRES-GFP or IRES-GFP alone (empty). LTR: long terminal repeat. The frequency of GFP+ cells was monitored over 14 d by flow cytometry and is shown relative to day 2. Two-way ANOVA with Tukey´s multiple comparisons test, * p < 0.05, ** p < 0.01, *** p < 0.001
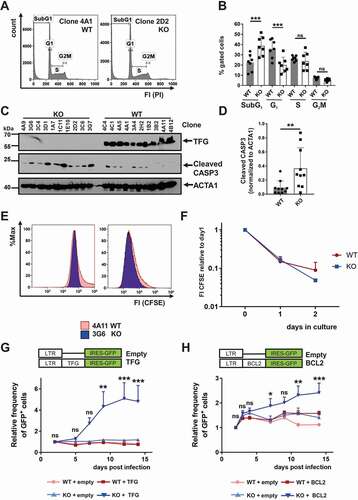
Figure 4. TFG localizes in vesicular structures and controls endoplasmic reticulum (ER) expansion in CH12 B cells. (a) CH12 tfg WT and KO cells were stained for IgM and TFG by indirect immunofluorescence and analyzed by confocal microscopy (single plane), scale bar, 8 μm, (b) Naïve and LPS-activated splenic B cells (3 d) were stained for intracellular IgM and TFG and analyzed by confocal microscopy (3D projection of 8 confocal planes, 1 μm each). Please note that the exposure time for IgM was much shorter than for non-activated cells due to the robust IgM signal (compare )). Scale bar, 10 μm, (c) CH12 WT cells were stained with ER-Tracker Blue-White and for IgM and TFG by indirect immunofluorescence and analyzed by confocal microscopy (3D projection of 7 single planes, 1 μm each), scale bar, 8 μm, (d) Upper panel: CH12 KO cells were stained with ER-Tracker Blue-White and IgM and analyzed by confocal microscopy (3D projection of 7 single planes, 1 μm each). Lower panel: CH12 WT cells were attached to glass slides in the presence of 1 mM dithiothreitol (DTT) for 3 h, stained for IgM and TFG by indirect immunofluorescence and analyzed by confocal microscopy (3D projection of 7 single planes, 1 μm each), scale bar, 8 μm (e) CH12 tfg WT and KO B cells (7 variant independent clones) were incubated with ER-Tracker Blue-White. Representative histogram overlays for ER-Tracker and forward scatter (FSC) are shown on the left. ER volume was measured by flow cytometry and normalized to cell size. Median fluorescence intensities are depicted, Mann Whitney U-test, * p < 0.05
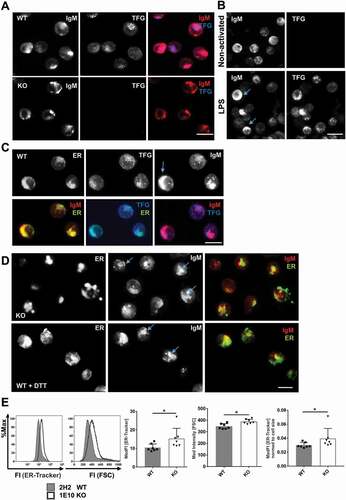
Figure 5. Elevated ER stress markers in CH12 tfg KO B cells. (a) CH12 tfg WT and KO B cells were lysed and TFG, HSPA5 and ACTB/ACTIN protein amount was assessed by western blotting as indicated. Molecular mass standards (kDa) are shown on the left. Quantification of HSPA5 abundance relative to ACTB is shown on the right. Mann Whitney U-test, * p < 0.05. (b) qPCR analysis of Hspa5, Pdia4, Xbp1s, Ccpg1 and Edem1 transcripts in CH12 tfg WT and KO B cells (7 clones each) kept in medium + solvent (DMSO) or tunicamyin, Mann Whitney U-test, * p < 0.05, ** p < 0.01, ***, p < 0.001 (c) qPCR analysis of Mcl1, Bax and Bcl2l11 expression in CH12 tfg WT and KO B cells (9 WT clones and 10 KO clones), Mann Whitney U-test, n.s
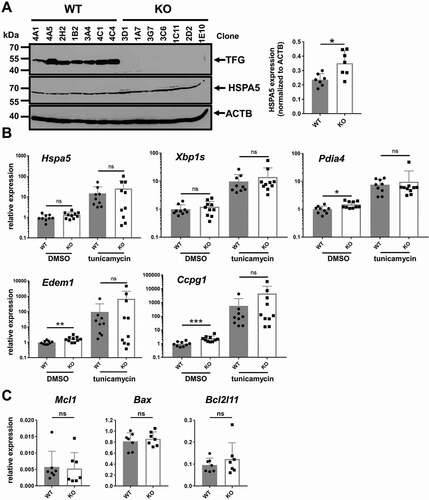
Figure 6. TFG ameliorates ER stress in CH12 B cells. (a)-(d) CH12 tfg WT and KO cells (7 clones each) were incubated with medium including carrier (DMSO or H2O) or the respective compound as indicated for 24 h. Viability was assessed by ANXA5-PI staining (upper panels). ER abundance was assessed by ER-Tracker Blue-White staining and flow cytometry (lower panels), Mann Whitney U-test, * p < 0.05, ** p < 0.01. (e) CH12 tfg WT and KO cells were infected with retroviruses encoding the functional μ heavy chain (μHC) 17.2.25 with IRES-GFP. LTR: long terminal repeat. The frequency of GFP+ cells was determined over 6 d and is represented relative to the frequency of GFP+ cells 1 d after infection. Intracellular IgM abundance as well as ER volume were determined by flow cytometry on day 7, Statistics: Two-way ANOVA for kinetic, Mann Whitney U-test for IgM and ER-Tracker, (f) CH12 tfg WT and KO cells were infected with retroviruses encoding the dysfunctional μ heavy chain (μHC) VH81.X with IRES-GFP. LTR: long terminal repeat. The frequency of GFP+ cells was determined over 6 d and is represented relative to the frequency of GFP+ cells 1 d after infection (=1). Intracellular IgM abundance as well as ER volume were determined by flow cytometry on day 7, Statistics: Two-way ANOVA for kinetic, Mann Whitney U-test for IgM and ER-Tracker, * p < 0.05, ** p < 0.01, (g) Lysates of 4 different CH12 tfg WT clones treated with DMSO or tunicamycin (see above) were separated by 15% SDS-PAGE, transferred to nitrocellulose and membranes were probed with antibodies as indicated on the right. Molecular mass standards are shown on the left (kDa). Mann-Whitney U-test, ** p < 0.01
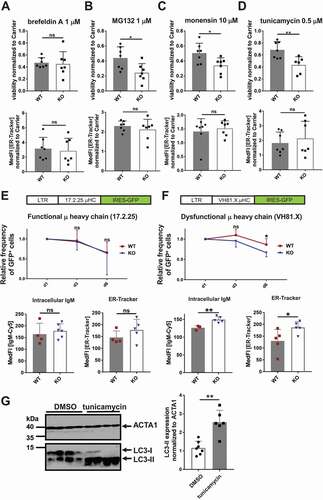
Figure 7. TFG is required for autophagy flux in CH12 B cells. (a) Lysates of CH12 tfg WT and tfg KO B cell clones were separated by 15% SDS-PAGE, transferred to nitrocellulose and membranes were probed with antibodies as indicated on the right. Molecular mass standards are shown on the left (kDa). Three WT and KO clones are shown, representative of 7 clones in total. (b) Quantification of LC3-I and LC3-II expression relative to ACTB/ACTIN. Mann Whitney U-test, * p < 0.05, ** p < 0.01. (c) CH12 tfg KO cells were infected with retroviruses encoding or IRES-GFP (-) or TFG-IRES-GFP (+) and GFP+ cells were sorted. Lysates of those cells were separated by 15% SDS-PAGE, transferred to nitrocellulose and membranes were probed with antibodies as indicated on the right. Molecular mass standards are shown on the left (kDa). All sections are from the same gel and exposure. (d) CH12 tfg WT and tfg KO cells were incubated in the presence or absence of NH4Cl and lysates were resolved by 15% SDS-PAGE (a representative gel is shown). Gels were blotted and blots were probed with antibodies indicated on the right. Molecular mass standards (kDa) are shown on the left. Arrows indicate positions of LC3-I and LC3-II. All sections are from the same gel and exposure. (e) Quantification and statistical analysis of LC3 turnover. One dot represents one clone, Mann Whitney U-test, ** p < 0.01. (f) CH12 tfg WT and KO B cells were fixed, embedded and analyzed by transmission electron microscopy. Representative images are shown on the left (magnification, x35970). Arrows point to autophagosomes. (g) Quantification of the number and size of autophagosomes (summary of two clones with 30–60 cells counted for each clone and condition); non-paired student’s t-test, ****p < 0.0005
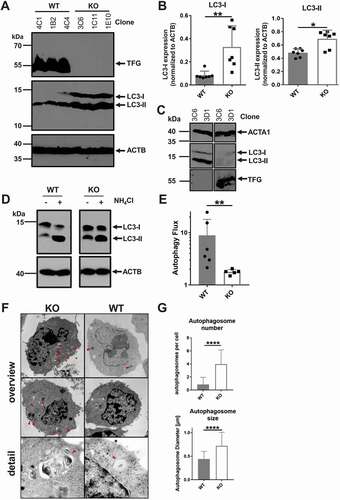
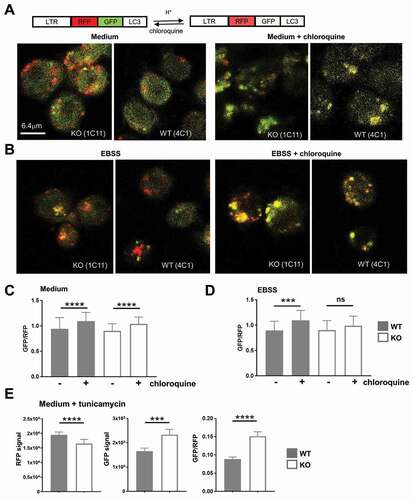
Figure 8. TFG supports autophagosome turnover in CH12 B cells. (a) CH12 tfg WT (4 C1) and KO B cells (1E10) were infected with a retrovirus encoding the RFP-GFP-LC3-fusion protein. LTR: long terminal repeat; RFP, red fluorescence protein. Cells kept for 2 h in medium with or without 100 µM chloroquine were attached to glass slides, fixed and analyzed by confocal microscopy (single plane). (b) CH12 tfg WT (4 C1) and KO B cells (1E10) were infected with a retrovirus encoding the RFP-GFP-LC3 fusion protein. Cells were attached to glass slides in EBSS for 2 h with or without 100 µM chloroquine, fixed and analyzed by confocal microscopy (single plane). (c), (d) GFP:RFP ratios of single autophagosomes (please see Figure S8) were calculated and are depicted as mean and SD; student’s t-test, *** p < 0.001, **** p < 0.0001, (e) CH12 tfg WT (clones 3A4, 4C1, 4C4) and KO B cells (clones 1C11, 1E10) were infected with a retrovirus encoding the RFP-GFP-LC3 fusion protein. Cells were attached to glass slides in medium for 2 h with or without 5 μM tuncamycin and fixed. GFP and RFP fluorescence intensities of single autophagosomes (392–798 per condition) were determined by confocal microscopy (single plane). Data are not represented by scatter plots due to too many data points and are shown as median +95% CI student’s t-test: *** p < 0.001, **** p < 0.0001