
Figures & data
Figure 1. ZIKV infection reduces the KPNA2 protein level. (A) ZIKV infection of Vero cells leads to a lower KPNA2 protein level while having minimal effect on KPNA1. The cells were inoculated with ZIKV PRVABC59 strain at an MOI of 10 and harvested for western blotting (WB) at 24 h post-infection (hpi). Relative levels of KPNA2 are shown below the images after normalization with house-keeping gene TUBB1/tubulin beta. (B) ZIKV infection has minimal effect of KPNA2 mRNA level detected by RT-qPCR. The relative KPNA2 mRNA level is shown in comparison to the mock-infected Vero cells after normalization with the house-keeping gene RPL32. The cells were infected with ZIKV PRVABC59 strain at an MOI of 10 and harvested at 24 hpi. Error bars represent the standard errors of the means of three repeated experiments. (C and D) ZIKV infection of HeLa and SK-N-SH cells reduces KPNA2 level while having minimal effect on KPNA1. The cells were inoculated with ZIKV PRVABC59 strain at an MOI of 10 and harvested at 48 hpi. (E) The infection of Vero cells with incremental ZIKV inoculum leads to a dose-dependent reduction of KPNA2. The cells were harvested for WB at 24 hpi. Relative levels of KPNA2 are shown below the images. (F) ZIKV RNA levels in the infected cells at 24 hpi detected by RT-qPCR. The relative RNA levels in comparison with the MOI of 0.1 are shown. Error bars represent the standard errors of the means of three repeated experiments. Significant differences in RNA level from the sample of MOI 0.1 are denoted by asterisks (**, P < 0.01; ***, P < 0.001). G. ZIKV reduces KPNA2 in Vero cells at both 24 and 48 hpi
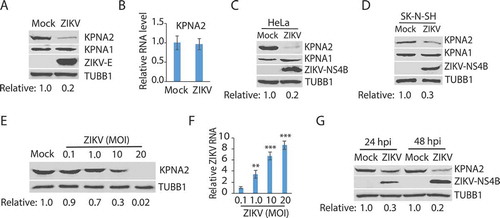
Figure 2. ZIKV infection induces KPNA2 degradation via the lysosomal pathway. (A) MG132 and NH4Cl treatment restore the KPNA2 level in ZIKV-infected cells. Vero cells were infected with ZIKV and 24 hpi, treated with MG132 or NH4Cl. The cells were harvested 6 h after the treatment. DMSO was included as a solvent control in the first two lanes. (B) The treatment with MG132 and NH4Cl for 6 h has minimal effect on cell viability. DMSO was included as a solvent control in the first two bars. (C) The treatment with MG132 and NH4Cl for 6 h has minimal effect on the ZIKV RNA level. (D) KPNA2 half-life is shortened by ZIKV infection. Vero cells were infected with ZIKV at an MOI of 10 for 24 h before treated with cycloheximide. Mock-infected cells were included for control. (E) ZIKV infection has a minimal effect on KPNA2 ubiquitination. Vero cells were infected with ZIKV, treated with NH4Cl for 6 h, and harvested for immunoprecipitation (IP) with KPNA2 antibody. The IP precipitate was subjected to WB with antibodies against ubiquitin (Ub) and KPNA2. The input of cell lysate was included as a control
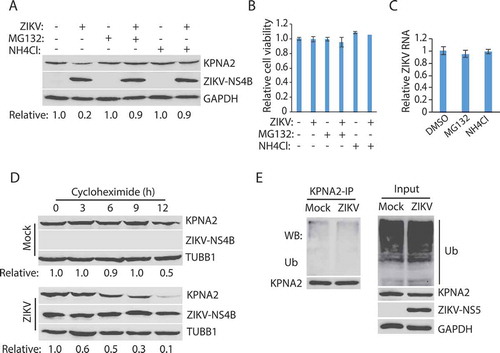
Figure 3. ZIKV-induced KPNA2 reduction is via the chaperon-mediated autophagy (CMA). (A) Co-immunoprecipitation (co-IP) of KPNA2 precipitates LAMP2A. Lysate of Vero cells was used for co-IP with KPNA2 antibody (anti-KPNA2) or an isotype control IgG (C-IgG). The input of the cell lysate was included in WB for control. (B) Co-IP of LAMP2A precipitates KPNA2. Lysate of Vero cells was used for co-IP with the LAMP2A antibody (anti-LAMP2A) or an isotype control IgG (C-IgG). (C) LAMP2A knockdown in Vero cells leads to the elevation of the KPNA2 level while having minimal effect on KPNA1. Vero cells stably transduced with recombinant retrovirus expressing control shRNA (C-shRNA) or shRNA against LAMP2A (shLAMP2A) were harvested for WB. Relative levels of LAMP2A, KPNA1, and KPNA2 are shown below the images. (D) LAMP2A knockdown in Vero cells has minimal effect on cell viability. NS: no significant difference. (E) ZIKV infection of Vero cells with LAMP2A knockdown has minimal effect on KPNA2. Vero cells stably transduced with retroviral shLAMP2A or C-shRNA were infected with ZIKV and harvested at 48 hpi for WB
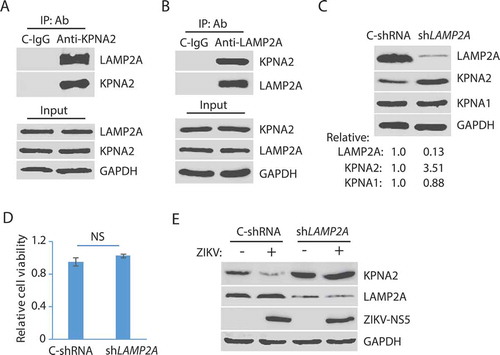
Figure 4. ZIKV NS2A protein induces KPNA2 reduction. (A and B). Identification of the ZIKV protein that causes KPNA2 reduction. HEK293 cells were co-transfected with the plasmids encoding the individual ZIKV proteins and HA-KPNA2. The cells were harvested for WB at 48 h post-transfection. Molecular weight markers are indicated on the left. Relative KPNA2 levels are shown below the images. EV: empty vector. (C) Dose-dependent reduction of KPNA2 by NS2A. HEK293 cells were co-transfected with HA-KPNA2 and NS2A plasmids. (D) KPNA2 is present in NS2A co-IP precipitates while YFP from the empty vector (EV) control is absent. HEK293 cells were co-transfected with HA-NS2A and YFP-KPNA2 plasmids. The input of cell lysate is included for control. (E) NS2A is present in KPNA2 co-IP precipitates. HEK293 cells were co-transfected with YFP-NS2A and HA-KPNA2 plasmids. (F) NS2A has minimal effect on the KPNA2 level in HEK293 cells with LAMP2A knockdown. HEK293 cells were transfected with control shRNA (C-shRNA) or shLAMP2A plasmids for 48 h and passaged. The transfection and passaging were repeated for three times before the cells were used for co-transfection with NS2A and KPNA2 plasmids. EV was included as a control. (G) NS2A expression in HEK293 cells has minimal effect on cell viability
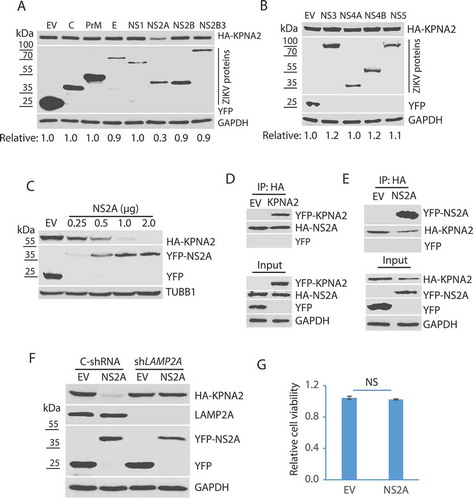
Figure 5. The amino acid residue T100 of NS2A is indispensable for the NS2A-mediated reduction of KPNA2. (A) Schematic illustration of the NS2A truncation constructs. The numbers above the lines indicate NS2A amino acid residues. (B) WB of KPNA2 in HEK293 cells co-transfected with plasmids of NS2A truncation constructs and HA-KPNA2. Wild-type (WT) NS2A and EV were included as controls. (C) Schematic illustration of mutant NS2A with point mutations. The amino acid residues of 96–100 are shown below the top line. Underlined residues indicate point mutations. M1: R96A, M2: N98A, M3: W99A, and M4: T100A. (D) WB of KPNA2 in HEK293 cells co-transfected with plasmids of mutant NS2A with point mutations and HA-KPNA2. WT NS2A and EV were included as controls. (E) Mutant NS2A-M4 (T100A) has minimal interaction with KPNA2. HEK293 cells were co-transfected with plasmids of HA-KPNA2 and WT NS2A or NS2A-M4. The input of cell lysate was included in WB. (F) Sequencing of the cDNA of the mutant ZIKV with NS2AT100A confirms the presence of codon mutation in its genome. The numbers above the sequence indicate nucleotide positions in cDNA of the ZIKV genome. The bar below the chromatogram indicates the codon change of T100A in NS2A. (G) Mutant ZIKV ICD (mNS2A) has a much lower proliferation than the WT virus. Vero cells were inoculated with an MOI of 0.01 for ZIKV proliferation and harvested for virus titration at 72 hpi. A significant difference is denoted by *** for P< 0.001. (H) Mutant ZIKV has minimal effect on the KPNA2 level. Vero cells were inoculated with an MOI of 10 for the mutant mNS2A virus or with an MOI of 1 for the WT virus to ensure both mutant and WT viruses had a similar level of replication and harvested at 48 hpi for immunoblotting
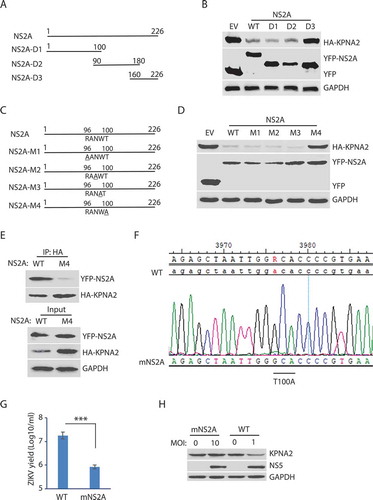
Figure 6. The residue Gln109 in the KPNA2 CMA motif is indispensable for NS2A-mediated reduction and ZIKV replication increases in the cells with KPNA2 knockdown. (A) Schematic illustration of KPNA2 mutation at the potential CMA motif. The numbers above the lines indicate KPNA2 amino acid residues. The underlined amino acid residues indicate point mutations. M1: mutation 1 (L104A and S105A), M2: R106A and K108A; M3: E107A, and M4: Q109A. (B) Effect of the point mutations in KPNA2 on NS2A-mediated KPNA2 reduction. WT KPNA2 and EV were included as controls. (C) Mutant KPNA2Q109A has much less interaction with LAMP2A than WT KPNA2. HEK293 cells were transfected with KPNA2-M4 or WT KPNA2 plasmids. The cells were treated with NH4CL for 6 h before harvested for co-IP. (D) The co-IP precipitate of mutant KPNA2Q109A contains much less NS2A than the precipitate of WT KPNA2. HEK293 cells were transfected with NS2A-YFP and KPNA2-M4 or WT KPNA2 plasmids. The cells were treated with NH4CL for 6 h before harvested for co-IP. (E and F). KPNA2 knockdown in Vero cells leads to higher ZIKV replication than control shRNA. Vero cells stably transduced with recombinant retrovirus expressing control shRNA (C-shRNA) or shRNA against KPNA2 (shKPNA2) were infected with ZIKV and harvested 48 hpi. ZIKV titers are shown as Log10/ml on Y-axis. A significant difference from cells with C-shRNA is denoted with *** for P< 0.001. (G) KPNA2 knockdown has minimal effect on Vero cell viability. NS: no significant difference. (H, I and J). KPNA2 knockdown in MARC-145 cells leads to significantly higher ZIKV replication than control shRNA in MARC-145 cells, whereas the cell viability remains stable
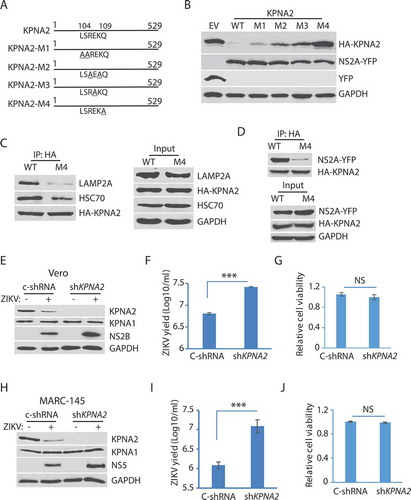
Table 1. List of primers used in this study