Figures & data
Figure 1. Autophagic activity was decreased in the livers of long-term-HFD-fed mice. (A) Representative TEM images of autophagic vacuoles in the liver. Scale bar: 2 μm (B) The number of autophagic vacuoles per μm2 of liver area was counted. (C) The expression of autophagy-related genes was analyzed using PCR array. The RNA samples from liver tissues were pooled by group, and PCR arrays were analyzed in triplicate. Autophagy-related genes selected using the criterion having FDR < 0.15 are labeled and colored in red. Bar plots of expression levels for the autophagy genes, with dots representing data points. (D) The expression of genes found to be downregulated in the PCR array analysis was validated using qRT-PCR. (E) Protein levels for selected autophagy-related genes in the livers of 5-week or 20-week HFD- or LFD-fed mice. (F) Abundance of the protein products of selected autophagy-related genes in HFD groups relative to that in LFD groups (density ratio of protein:ACTB). (G) Autophagy-related gene mRNA levels in fatty liver (n = 6) and adjacent normal liver tissue samples (n = 5) from hepatocellular carcinoma patients were analyzed. Values represent mean ± SEM (n = 10). * p < 0.05; ** p < 0.01; *** p < 0.001, compared to LFD or normal liver tissues (Con, control). Ambra1: autophagy and beclin 1 regulator 1; ATG: autophagy-related; GABARAP: gamma-aminobutyric acid receptor associated protein; HFD: high-fat diet; LFD: low-fat diet; Leup: leupeptin; mRNA: messenger RNA; NAFLD: nonalcoholic fatty liver disease; ns: not significant; PCR: polymerase chain reaction; PIK3C3: phosphatidylinositol 3-kinase catalytic subunit type 3; qRT-PCR: quantitative reverse transcription PCR; RNA: ribonucleic acid; SEM: standard error of mean; SQSTM1/p62: sequestosome 1; TEM, transmission electron microscopy; ULK1: unc-51 like kinase 1; Uvrag: UV radiation resistance associated gene
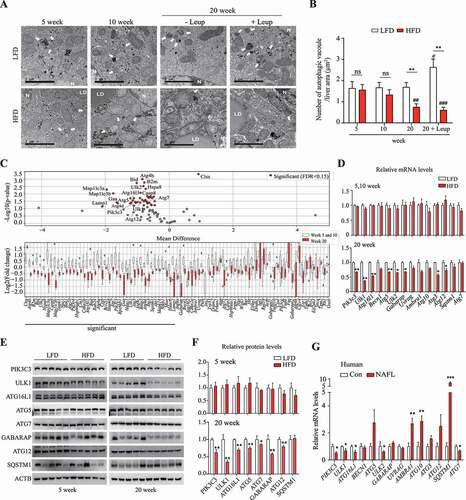
Figure 2. Mir214-3p downregulated Ulk1 expression through direct binding to the Ulk1 gene. (A) The regulatory network of microRNAs and TFs in the regulation of target mRNA. (B) miRNA levels were analyzed using a TLDA kit. The RNA samples from the livers were pooled by group, and PCR arrays were analyzed in triplicate. (C) The miRNA levels in the liver of a human NAFLD patient were compared to those of a person without fatty liver (Con, control) (n = 5). (D) miRNA–autophagy-related gene interactions were analyzed using miRWalk and TargetScan. (E) miRNA–autophagy-related gene interactions were analyzed using a target-prediction website. Red indicates higher expression, and green indicates lower expression, relative to the LFD group. The intensity of the color, and the size, indicate the degree of change in expression. (F) The expression of miRNAs that were upregulated according to TLDA analysis was validated using qRT-PCR. Values represent mean ± SEM (n = 10). * p < 0.05; ** p < 0.01; *** p < 0.001, compared to the LFD group. (G–H) The expression of autophagy-related genes in (G) miRNA inhibitor-transfected or (H) mimic-transfected cells. Increase is indicated in red, and decrease is indicated in blue, relative to the negative control (n = 3). (I) Hepatocytes were transfected with the Mir214-3p inhibitor or mimic for 48 h; the protein levels of the target autophagy-related genes were then measured using immunoblotting. (J) Dual reporter assay was performed using the GLuc-SEAP vector containing 3′ UTR of Ulk1 mRNA. Hepatocytes were co-transfected with the GLuc-SEAP vector and Mir214-3p mimic for 48 h. After incubation, luciferase activity in the medium was measured, and Mir214-3p levels were quantified in cell lysates. (K) Luciferase activity was measured in hepatocytes transfected with the GLuc-SEAP vector of Ulk1 3′ UTR containing the wild-type or mutated Mir214-3p binding sites. Values represent mean ± SD (n = 3). * p < 0.05; ** p < 0.01; *** p < 0.001, compared to the NC. GLuc: Gaussia luciferase; HFD: high-fat diet; LFD: low-fat diet; miRNA: microRNA; mRNA: messenger RNA; NAFLD: nonalcoholic fatty liver disease; NC: negative control; PCR: polymerase chain reaction; qRT-PCR: quantitative reverse transcription PCR; SD: standard deviation; SEAP: secreted alkaline phosphatase; SEM: standard error of mean; TF: transcription factor; TLDA: TaqMan low-density array; UTR: untranslated region
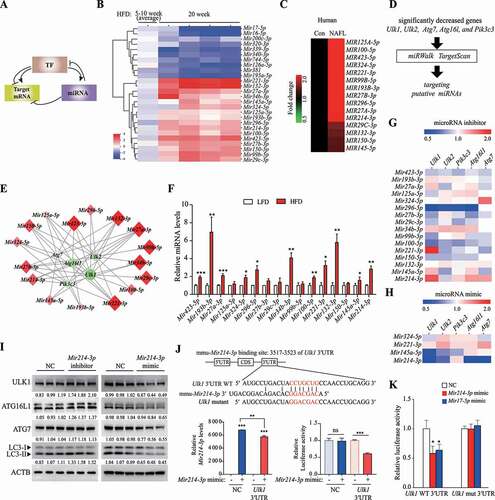
Figure 3. HNF4A upregulated Ulk1 expression through direct binding to the Ulk1 gene. (A) Differences between the means of expression levels at 5 and 10 week, and those at 20 week. TFs selected using the criterion having FDR < 0.15 were labeled and colored red or blue to indicate elevated or reduced expression, respectively. (B) TF expression that was significantly increased or decreased according to PCR array analysis was validated using qRT-PCR. Values represent mean ± SEM (n = 10). *** p < 0.001, compared to the LFD group. (C) ATF3 and HNF4A levels in the liver of human NAFLD patients were analyzed using TaqMan probe, compared to those from a person without fatty liver (Control, CON). (n = 5). (D) Hepatocytes were transfected with the indicated siRNA for 48 h; the target autophagy-related gene mRNA levels were measured using qRT-PCR. Values represent mean ± SD (n = 3). ** p < 0.01; *** p < 0.001, compared to the negative control. (E–F) Hnf4a-overexpressing hepatocytes were generated using an Hnf4a mouse retroviral vector. (E) The mRNA levels of Ulk1 and Ulk2 and (F) protein levels of ULK1 and LC3 were measured in Hnf4a-overexpressing cells. Values represent mean ± SD (n = 3). * p < 0.05; *** p < 0.001, compared to normal hepatocytes (control). (G) ChIP assay was performed using the HNF4A antibody in hepatocytes. *** p < 0.001, compared to the negative control (IgG). (H) The expression of autophagy-related genes in Hnf4a-overexpressing hepatocytes was analyzed using PCR array, and the difference in expression of autophagy-related genes is shown in the heatmap. (I) Genes that were upregulated based on PCR array analysis were validated using RT-PCR. ChIP: chromatin immunoprecipitation; FDR: false discovery rate; HFD: high-fat diet; IgG: immunoglobulin G; LFD: low-fat diet; mRNA: messenger RNA; NAFLD: nonalcoholic fatty liver disease; PCR: polymerase chain reaction; qRT-PCR: quantitative reverse transcription PCR; SD: standard deviation; SEM: standard error of mean; siRNA: small interfering RNA; TF: transcription factor
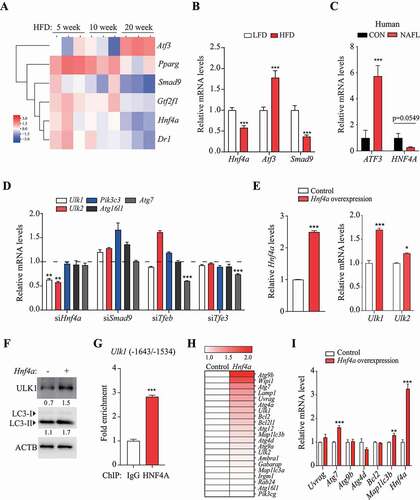
Figure 4. Mir214-3p and Hnf4a independently regulated Ulk1 expression. (A–B) Hepatocytes were transfected with (A) Mir214-3p inhibitor or (B) mimic for 48 h; Hnf4a expression was measured using qRT-PCR. Values represent mean ± SD (n = 3). * p < 0.05; *** p < 0.001, compared to the negative control (NC). (C) Hepatocytes were co-transfected with anti-Mir214-3p and Hnf4a siRNA for 48 h. After incubation, relative expression of Ulk1 and Ulk2 was measured using qPCR. (D) Mir214-3p mimic was transfected into Hnf4a-overexpressing hepatocytes for 48 h. After incubation, relative protein levels were measured using immunoblotting. (E) Protein levels (expressed as the density ratio of protein:ACTB) were quantified using ImageJ. (F) Autophagy flux assay performed using the lysosomal inhibitor chloroquine (CQ). Mir214-3p mimic or inhibitor was transfected into Hnf4a-overexpressing hepatocytes for 48 h. Cells were treated with or without 10 µM CQ for 4 h. (G–H) Dual reporter assay was performed using GLuc-SEAP vector containing the 3′ UTR of Hnf4a mRNA. Hepatocytes were co-transfected with Glu-SEAP vector and (G) Mir214-3p mimic or (H) anti-Mir214-3p for 48 h. Luciferase activity in the medium was measured, and Mir214-3p levels were quantified in cell lysates. Values represent mean ± SD (n = 3). *** p < 0.001, compared to the negative control. GLuc: Gaussia luciferase; mRNA: messenger RNA; NC: negative control; qPCR: quantitative polymerase chain reaction; SD: standard deviation; siRNA: small interfering RNA; SEAP: secreted alkaline phosphatase; UTR: untranslated region
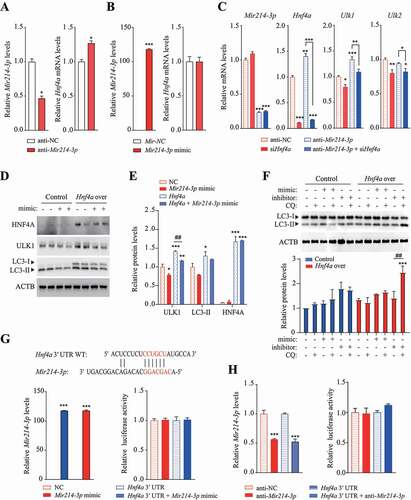
Figure 5. Inhibition of Mir214-3p ameliorated hepatic steatosis in HFD-fed mice. (A) nonalcoholic fatty liver was induced by 60 kcal% HFD feeding for 16 weeks and LNA-anti-Mir214-3p was administered twice intraperitoneally to inhibit Mir214-3p levels. (B) Mir214-3p levels in the liver were measured 1 week after the final LNA-anti-Mir214-3p administration. (C) Final body weight gain. (D) Liver weight. (E) Hematoxylin and eosin staining of the liver. (F) Hepatic total lipid and triglyceride levels were measured in the liver. Values represent mean ± SEM (n = 10). * p < 0.05; *** p < 0.001, compared to the HFD-fed group. (G) Representative TEM images of autophagic vacuoles in the liver. In the enlarged insets, autophagosome aggregation is observed in Leup-treated livers. Scale bar: 1 μm (H) The number of autophagic vacuoles per μm2 of liver area was quantified. Values represent mean ± SEM (n = 10). * p < 0.05; *** p < 0.001, compared to the group not treated with Leup. (I) The LC3 protein levels in the liver in the presence or absence of Leup. (J) The expression of Mir214-3p target genes was measured using qRT-PCR. Values represent mean ± SEM (n = 6). * p < 0.05; ** p < 0.01; *** p < 0.001, compared to the HFD group. (K) Liver tissue levels of proteins encoded by genes targeted by Mir214-3p. (L) Schematic overview of this study. Mir214-3p directly downregulates Ulk1 expression to ultimately inhibit autophagic activity. Reduced expression of Hnf4a by HFD feeding also reduced Ulk1 expression, leading to hepatic steatosis. PRKAA/AMPKa: adenosine monophosphate-activated protein kinase, alpha catalytic subunit; HFD: high-fat diet; Leup: leupeptin; LFD: low-fat diet; LNA: locked nucleic acid; qRT-PCR: quantitative reverse transcription polymerase chain reaction; SEM: standard error of mean; TEM: transmission electron microscopy
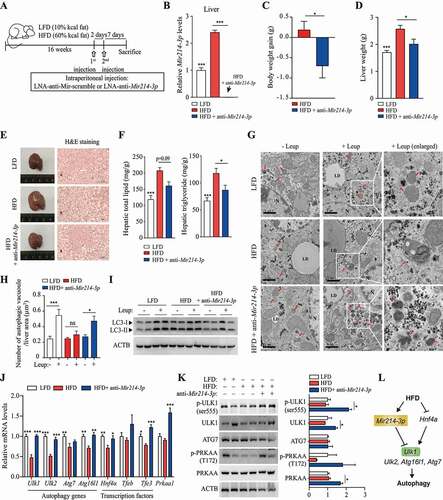
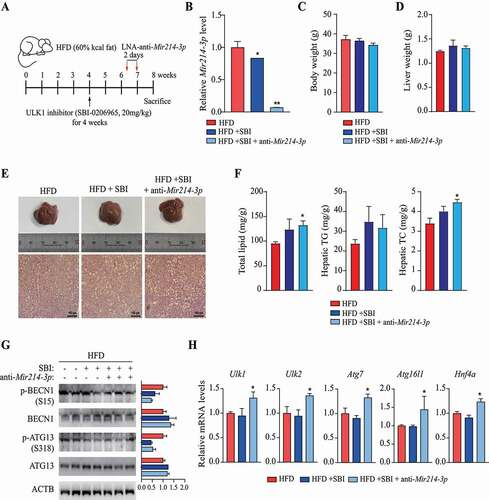
Figure 6. Regulation of Ulk1 expression by Mir214-3p is important for the mitigation of hepatic steatosis. (A) Scheme of in vivo experiments. To induce nonalcoholic fatty liver, mice were fed 60 kcal% HFD. At 4 weeks, SBI-0206965 (ULK1 inhibitor) was injected intraperitoneally to reduce ULK1 activity, and LNA-anti-Mir214-3p was administered twice after 2 weeks. (B) Relative Mir214-3p levels in the liver tissue. These levels were measured 1 week after the final anti-Mir214-3p administration. (C) Final body weight. (D) Liver weight. (E) Representative images of H&E-stained liver section. Scale bar: 100 μm (F) Total hepatic lipid, triglyceride (TG), and total cholesterol (TC) levels. (G) Protein production from autophagy-related genes in the liver. Levels of proteins phosphorylated by ULK1 to induce autophagy were measured in the liver. (H) mRNA levels of autophagy genes targeted by Mir214-3p. Values represent mean ± SEM. * p < 0.05; ** p < 0.01. BECN1: beclin 1; H&E: hematoxylin and eosin; HFD: high-fat diet; LNA: locked nucleic acid; SEM: standard error of mean