Figures & data
Figure 1. Env-induced autophagy is a prerequisite for apoptosis in CD4+ T cells. (A) Description of the cellular models. The experiments are based on the co-culture between effector cells expressing Env at their surface and target cells expressing CD4 and CXCR4. In the model 1, target cells are either primary CD4+ T lymphocytes purified from healthy donor blood samples or a CD4+ T cell line expressing CXCR4. Effector cells are HEK293 stably expressing Env (HEK.Env). HEK293 cells are used as negative control. In the model 2, target cells are HEK293 cells stably expressing CD4 and CXCR4. Effector cells are 8.E5 cells, which are chronically infected cells and thus express Env at their surface. The parental CEM cell line is used as a negative control. (B-D) Env-induced apoptosis depends on autophagy. Target CD4+ T cells were co-cultured for 48 h with HEK293 or HEK.Env in the presence or absence of (B) AMD3100 (1 µg/ml), (C) spautin 1 (50 μM), (D) BafA1 (50 nM). Target cells were harvested and fold increase in Env-mediated apoptosis was studied by quantifying the cleavage of PARP using HTRF. Results are from at least 3 independent experiments. *p < 0.05; **p < 0.01; ***p < 0.001. (E and F) Env-induced autophagy participated in ROS production that is responsible for uninfected CD4+ T cells apoptosis. Target CD4+ T cells (either T cell line, E or primary CD4+ T cells, F) were co-cultured for 48 h with HEK or HEK.Env in the presence or absence of NAC (10 mM). Target cells were harvested and fold increase in Env-mediated apoptosis was studied by quantifying the cleavage of PARP using HTRF. Data are representative of at least three independent experiments. **p < 0.01; ***p < 0.001. (G) Target CD4+ T cells were co-cultured for 48 h with HEK293 or HEK.Env in the presence or absence of spautin 1 (50 µM). Analysis of intracellular ROS production was measured by flow cytometry using DHR 123. Data are representative of at least three independent experiments. *p < 0.05; **p < 0.01
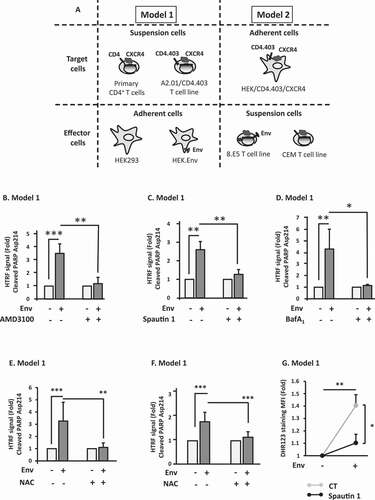
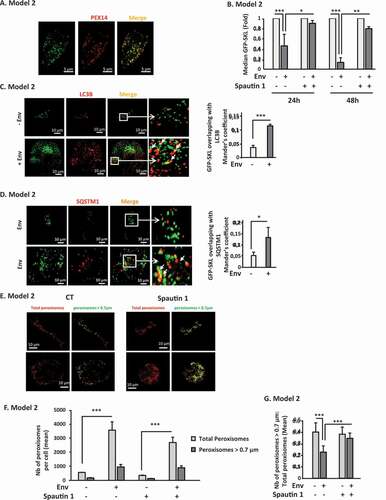
Figure 2. PEX14 is degraded by Env-induced autophagy. (A) Env induces a decrease in PEX14 expression level. PEX14 expression level was analyzed in target CD4+ T cells after 48 h of co-culture with effector HEK293 cells expressing or not Env, in the presence or absence of AMD3100 (1 µg/ml). The expression level ratios of PEX14 were calculated between the conditions with or without Env and normalized to that obtained with anti-GAPDH Ab. Data are representative of at least 3 independent experiments. *p < 0.05. (B) PEX14 is degraded in lysosomes in response to Env. PEX14 expression level was analyzed in target CD4+ T cells after 48 h of co-culture with effector HEK293 cells expressing or not Env, in the presence or absence of AP (E64d + pepstatin A, 10 µM each). The expression level ratios of PEX14 were calculated between the conditions with or without Env and normalized to that obtained with anti-GAPDH antibody. Data are representative of at least 3 independent experiments. **p < 0.01. (C) Autophagy is involved in Env-mediated PEX14 degradation. HEK/CD4.403/CXCR4 cells were co-cultured during 48 h with effector cells expressing or not Env (8.E5 or CEM, respectively) after their transfection with BECN1 (siBECN1) or control (siCT) siRNAs. Reduction in BECN1 expression was analyzed by western blot using the specific Abs. The expression level ratios of PEX14 were calculated between the conditions with or without Env and normalized to that obtained with anti-GAPDH Ab. Data are representative of at least 3 independent experiments. **p < 0.01. (D) SQSTM1/p62 is involved in the Env-mediated PEX14 degradation. HEK/CD4.403/CXCR4 cells were co-cultured during 48 h with effector cells expressing or not Env (8.E5 or CEM, respectively) after their transfection with SQSTM11/p62 (siSQSTM1) or control (siCT) siRNAs. Reduction in SQSTM1/p62 expression was analyzed by western blot using the specific Abs. The expression level ratios of PEX14 were calculated between the conditions with or without Env and normalized to that obtained with anti-GAPDH Ab. Data are representative of at least 3 independent experiments. **p < 0.01
Figure 3. Env-induced autophagy targets mature peroxisomes. (A) The SKL motif drives GFP to peroxisomes. Target cells were transfected with the GFP-SKL construct. Twenty-four h later, peroxisomes were labeled using an anti-PEX14 antibody. Images were acquired with a confocal microscope. (B) The GFP-labeled peroxisomes decrease overtime in target cells after their co-culture with effector cells expressing Env. Target cells were transfected with the GFP-SKL construct. Twenty-four h later, the transfected cells were co-cultured with effector cells in presence or not spautin 1 (50 µM). The mean fluorescence intensity (MFI) of the GFP signal was analyzed in target cells using flow cytometry after 24 and 48 h of co-culture. Data are representative of at least 3 independent experiments. *p < 0.05; **p < 0.01; ***p < 0.001. (C) The colocalization between the GFP labeled peroxisomes and LC3B increases in target cells upon Env exposure. Target cells were transfected with the GFP-SKL construct. Twenty-four h later, the transfected cells were co-cultured with effector cells in the presence of BafA1 (50 nM). Autophagosomes were labeled using an anti-LC3B by immunofluorescence. The graph represents the overlap of peroxisomes staining in the LC3B-positive structures. Data were acquired for the total volume of at least 15 cells and are representative of at least 3 independent experiments. ***p < 0.001. (D) The same experiment as C was done using an anti-SQSTM1/p62 antibody. The graph represents the overlap of peroxisomes staining in the SQSTM1/p62-positive structures. Data are representative of 3 independent experiments. *p < 0.5. (E) Target cells were stained by immunofluorescence with an anti-PEX14 antibody after 48 h of co-cultures with effector cells in presence or not of spautin 1 (50 µM). Total peroxisomes (in red) of each image were submitted to a computer-generated mask using the “Cell Profiler” software in order to identify only the peroxisomes for which the diameter is > 0.7 µm (in green). (F and G) In the same experiments as E, we quantified, respectively, (F) the mean number of total peroxisomes, and the number of large ones and (G) the ratio of the number of large peroxisomes over the number of total peroxisomes per cell, in each condition. The total volume of the target cells was imaged using a confocal microscope. Data obtained with the “Cell Profiler software” are representative of at least 3 independent experiments. ***p < 0.001