Figures & data
Figure 1. Sert induces autophagic flux in HUVECs. (A) Chemical structure of Sert. (B) MAP1LC3B-positive autophagosomes (green) were increased by both Sert (5 μM) and Inda (5 μM) in HUVECs. The cells were treated with Sert or Inda for 24 h in HUVECs. And then, the cells were harvested, followed by treatment with MAP1LC3B (green) antibody for 1 h. Nuclei were stained with DAPI. MAP1LC3B puncta was monitored by confocal microscopy. Scale bar: 5 μm. Graph of fluorescence is shown in (B). Values are means ± SEM; n = 20 cells. ***p < 0.001. (C) The MAP1LC3B immunofluorescence (green) also exhibited an increased number of cells containing vacuoles in the cytoplasm after Sert treatment as dose-dependent manner. The cells were treated with Sert (5 μM) or Inda (5 μM) for 24 h in HUVECs. And then, the cells were harvested, followed by treatment with MAP1LC3B (green) antibody for 1 h. Nuclei were stained with DAPI. MAP1LC3B puncta was monitored by confocal microscopy. Scale bar: 5 μm. Graph of fluorescence is shown in (C). Values are means ± SEM; n = 20 cells. ***p < 0.001. (D) Western blot analysis of the levels of MAP1LC3-II and SQSTM1 in cells after Baf (10 nM) or Inda (5 μM) or Sert (5 μM) treatment for 24, 48, and 72 h. (E) The effect of E64D on the levels of SQSTM1 and MAP1LC3-II in cells after treatment with autophagy-regulating compounds. Cells were treated with E64D (20 μg/mL) for 1 h pretreatment, and then Baf (10 nM), Inda (5 μM), or Sert (5 μM) treated for 24 h prior to harvesting for western blot analysis of SQSTM1, MAP1LC3 and ACTB. The levels of SQSTM1 and MAP1LC3-II was quantitated from the western blot data and normalized with the ACTB level. The E64D effect on SQSTM1 and MAP1LC3-II levels was expressed as the fold change after calculating the ratio of SQSTM1 or MAP1LC3-II level in E64D treated cells to untreated cells (E64D:no treatment). Graph of fluorescence is shown in (E). Values represent means ± SEM of fold-changes; n = 3, **p < 0.01, ***p < 0.001 between two indicated groups. (F) Autophagic flux evaluation in HUVEC cells using mCherry-GFP MAP1LC3 in the presence of each compound. Representative images of merged channels are shown; scale bar: 10 μm. Pearson coefficient for the colocalization analysis is shown. Quantification of data is shown in (F). Values are means ± SEM; n > 10 cells, ***p < 0.001. (G) Acridine orange (red) staining was used to visualize lysosomal uptake. The samples were treated with Sert (5 μM), Inda (5 μM), and Baf (10 nM) for 24 h. Cells were treated with acridine orange (2 μg/mL) for 20 min before fixation. After fixation, samples were examined by confocal microscopy. Scale bar: 10 μm. Quantification of data is shown in (G). Values are means ± SEM; n > 20 cells. ***p < 0.001
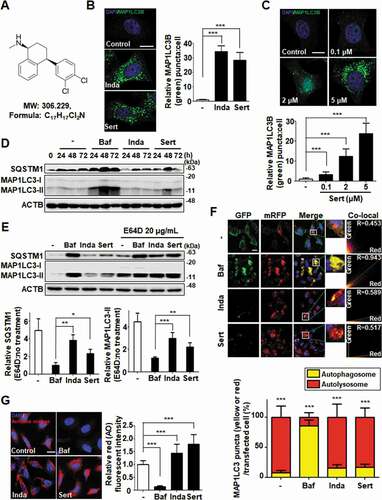
Figure 2. Sert induces autophagy by affecting the AMPK-MTOR-RPS6KB1 signaling axis. (A) ATP levels in HUVECs were measured using an ATPlite luminescence assay system. ATP levels decreased following treatment with Sert (5 μM) for 6 h. Values are means ± SEM; n = 4. **p < 0.01, ***p < 0.001. (B) Western blot analysis of the levels of p-AMPK, AMPK, p-MTOR, MTOR, p-RPS6KB1, and RPS6KB1 in cells after each compound treatment for 30 min. Quantification of data is shown in (B) from three independent experiments. Values are means ± SEM. *p < 0.05, **p < 0.01, ***p < 0.001. (C) Western blot analysis of the levels of p-ACACA, ACACA, and ACTB in cells after each compound treatment for 30 min. (D) The cells were co-treated with CC (10 μM) 1 h prior to Sert (5 μM) or Rapa (10 μM). And then, the cells were harvested, followed by treatment with MAP1LC3B (green) antibody for 1 h. Nuclei were stained with DAPI. Scale bar: 10 μm. Quantification of data is shown in (D). Values are means ± SEM; n > 20 cells. ***p < 0.001; scale bar: 10 μm
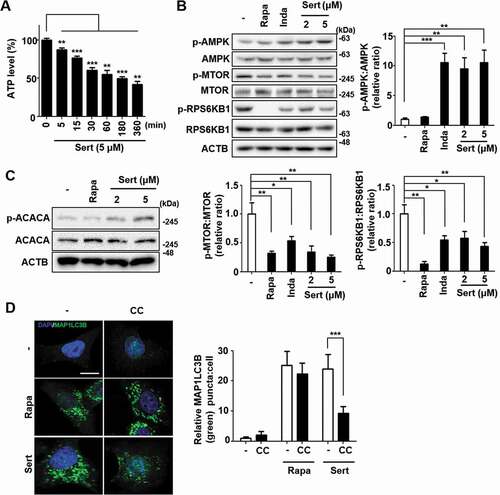
Figure 3. Sert induces STK11-mediated autophagy without TFEB translocation. (A) The effect of Sert on STK11 pathway. HUVECs were treated with DMSO or Sert (5 μM) for indicated time points before harvesting for western blot analysis of STK11 and phosphorylated STK11 at S428 (p-STK11-S428). Western blot data were quantitated and the ratio of phosphorylation vs total STK11 is shown in the bar graph (right panel). (B) The effect of Sert on CAMKK2 pathway. HUVECs were treated with the CAMKK2 inhibitor STO-609 (10 μM) for 30 min and then subsequently treated with ionomycin (Iono, 3 μM) or Sert (5 μM) for an additional 30 min before harvesting for western blot analysis of ACACA, phosphorylated ACACA (p-ACACA), and ACTB. (C) MAP1LC3B positive puncta (green) were increased by Sert treatment in HUVECs. Each autophagy inhibitors (3-MA, WM, PD98059) were treated 1 h prior to Sert treatment. Images are obtained from confocal microscopy. Quantification of data is shown in (C) shows quantitative analysis of MAP1LC3B puncta from three independent experiments. Values are means ± SEM. **p < 0.01, ***p < 0.001; scale bar: 10 μm. (D) TFEB nuclear translocation assay through EGFP-TFEB transfection of HUVECs under DMSO or MSL (100 μM) treatment for 3 h or Sert (5 μM) treatment from 2 to 24 h. And then, the cells were harvested, followed by treatment with TFEB (green) antibody for 1 h. Nuclei were stained with DAPI. Scale bar: 20 μm. Quantification of data is shown in (D)
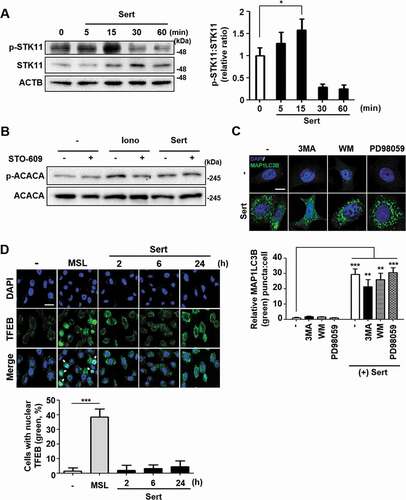
Figure 4. Biophysical validation reveals VDAC1 as a new protein target of Sert. (A) The DARTS assay for target validation. VDAC1 protein stability was increased upon Sert (100 μM) treatment in HUVECs lysates. Pronase treatment was conducted for 5, 10, and 20 min. The graph plots the quantification data is shown in (A). n = 3, *p < 0.05, **p < 0.01. (B) The DARTS assay demonstrated the dose-dependent binding of Sert to VDAC1. Treatment with pronase (5 μg/mL) was conducted for 10 min. The graph plots the quantification data is shown in (B). n = 3, *p < 0.05, **p < 0.01. (C) In silico docking model of Sert interacting with VDAC1 (human VDAC1, RCSB PDB ID: 2JK4). Sert bound to the VDAC1 between α-helix and β-sheet in the most stable pose and binding motifs were depicted with several high-affinity interactions between Sert and the VDAC1 pocket. Ligands are shown as gray sticks in displayed hydrogen bond surfaces. Bonds are shown as dashed lines color-coded as follows: hydrophobic interactions in orange, electrostatic interaction in purple, and hydrogen bonds in green and sky blue
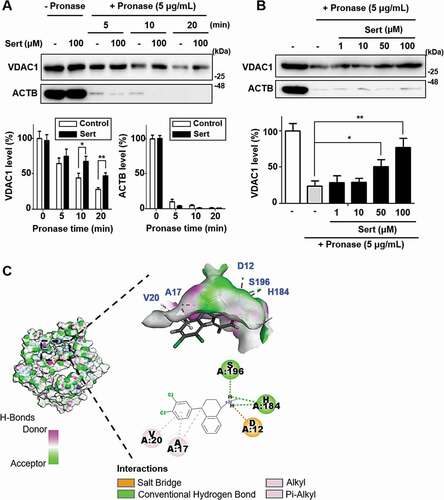
Figure 5. Biological validation using vdac1-knockout cells reveals that VDAC1 is a biological relevant protein target of Sert. (A) Western blot analysis of the levels of VDAC1, p-MTOR, MTOR, p-AMPK, AMPK, and ACTB in cells after each compound treatment for 30 min in WT MEFs or vdac1-knockout MEFs. The graph plots the quantification data is shown in (A). n = 3, *p < 0.05, **p < 0.01. (B) MAP1LC3 positive puncta (green) were increased by Sert (5 μM) treatment in WT MEFs, whereas vdac1-knockout MEFs treated with Sert did not induce autophagic vesicles formation. The cells were treated with Sert (5 μM) or Rapa (10 μM) for 24 h in HUVECs. And then, the cells were harvested, followed by treatment with MAP1LC3B (green) antibody for 1 h. Nuclei were stained with DAPI. Images were obtained from confocal microscopy. Quantification of data is shown in (B). Values are means ± SEM; n > 10 cells, ***p < 0.001; scale bar: 10 μm. (C) Autophagic flux evaluation in WT MEFs or vdac1-knockout MEFs using mCherry-GFP MAP1LC3 in the presence of each compound. Representative images of merged channels are shown; scale bar: 10 μm. Pearson coefficient for the colocalization analysis is shown. Quantification of data is shown in (C). Values are means ± SEM; n > 10 cells, **p < 0.01, ***p < 0.001. (D) Effect of Sert treatment on the proliferation of WT MEFs and vdac1-knockout MEFs. All cells were treated with Sert (0–5 μM) for 72 h, and cell growth was measured using an MTT colorimetric assay. N = 3, Values are means ± SEM. **p < 0.01, ***p < 0.001
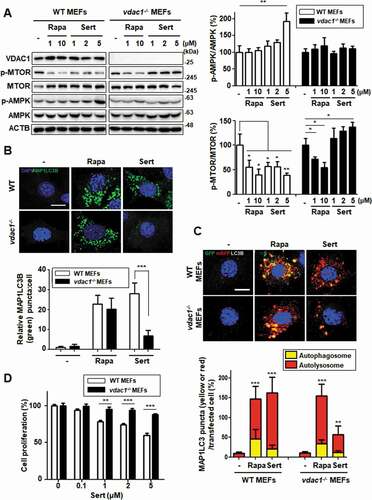
Figure 6. Validation of the binding site of Sert on VDAC1 (A) For DARTS assay, vdac1−/- MEF cells were transfected with WT MYC-VDAC1, MYC-VDAC1H184P or MYC-VDAC1S196A vectors at 1500 nM each for 48 h. And then, the cells were harvested, lysed, followed by treatment with (Sert, 100 μM) treatment. Pronase treatment (5 μg/mL) was conducted for 10 min. The graph plots the quantification data is shown in (A). n = 3, *p < 0.05. (B) VDAC1−/- MEF cells were transfected with WT MYC-VDAC1, MYC-VDAC1H184P or MYC-VDAC1S196A vectors at 200 nM each for 24 h. Then, the cells were treated with Sert (5 μM) for an additional 24 h. And then, the cells were harvested, followed by treatment with MYC (red) and MAP1LC3B (green) antibody for 3 h. Nuclei were stained with DAPI. Images were obtained from confocal microscopy. Quantification of data is shown in (B). Values are means ± SEM; n > 10 cells, *p < 0.05, **p < 0.01, ***p < 0.001; scale bar: 10 μm
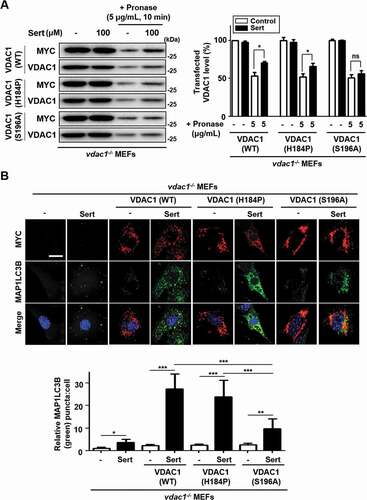
Figure 7. Sert-induced autophagy degrades MAPT protein in vitro. (A) MAP1LC3-II level after compound treatment for 24, 48, and 72 h. Sert treatment induced autophagic degradation of MAP1LC3-II level for 48–72 h, as like Rapa treatment. (B) Inducible MAPT cells were treated with DMSO or doxycycline (1 ng/mL) with DMSO or Rapa (10 μM), or Sert (1 μM) for 48 h. Samples were subjected to SDS–polyacrylamide gel electrophoresis/IB. (C) The aggregated nature and cellular localization of MAPT oligomers. MAPT-BiFC cells were incubated with DMSO or okadaic acid (OA, 30 nM) with DMSO or Rapa (10 μM), or Sert (1 μM) for 48 h (upper panel). After fixation, each sample was examined by confocal microscopy. Scale bar: 5 μm. Graph of fluorescence in down panel. Values are means ± SEM; n = 10 cells. ***p < 0.001, **p < 0.01. (D) Inducible MAPT cells were pretreated with Sert (1 μM) for 6 h with doxycycline (1 ng/mL) before the co-treatment with either MG132 (20 μM) or chloroquine (CQ, 5 μM) for additional 40 h
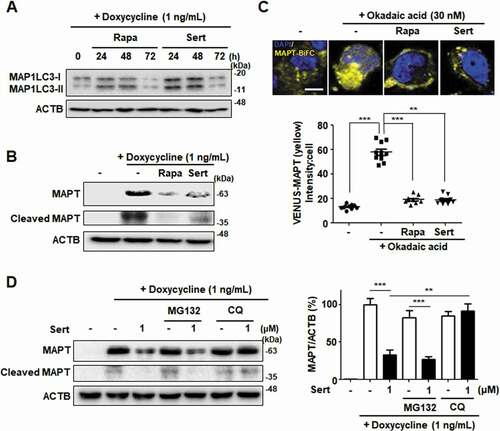
Figure 8. Sert degrades both MAPT proteins in vitro via AMPK-induced autophagy. (A) Inducible MAPT cells were treated with DMSO or doxycycline (1 ng/mL) with Sert (1 μM) in a time-dependent manner. Western blot analysis of the levels of p-AMPK and AMPK in cells after each compound treatment. (B) Inducible MAPT cells were pretreated with doxycycline (1 ng/mL) for 24 h. And then, Sert (1 μM) was treated for 48 h. The graph plots the quantification data is shown in (B). n = 3, *p < 0.05, **p < 0.01. (C) Degradation of MAPT oligomers (yellow) was visualized in BiFC cells when cells were co-treated with CC (10 μM) 1 h prior to Sert (1 μM) or Rapa (10 μM). Scale bar: 20 μm. Quantification of data is shown in (C). Values are means ± SEM; n > 20 cells. **p < 0.01, ***p < 0.001. (D) Western blot analysis of the level of p-MAPT (S262), total MAPT, and ACTB in inducible MAPT cells after Sert (1 μM) treatment. The graph plots the quantification data is shown in (D). n = 3, *p < 0.05, **p < 0.01, ***p < 0.001
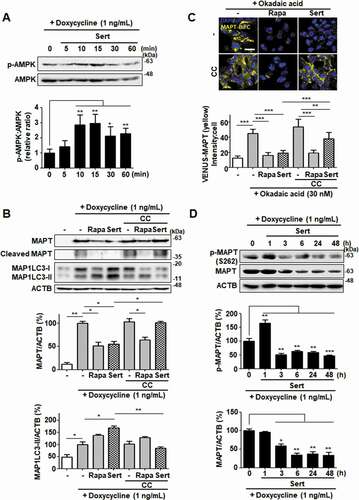
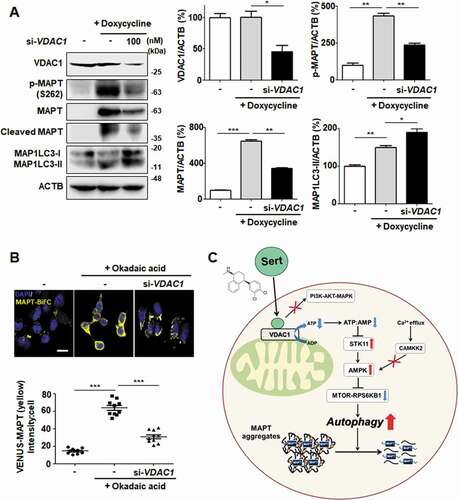
Figure 9. VDAC1 is a biologically relevant target protein of Sert-induced biological activity on tauopathy. (A) Western blot analysis of the level of VDAC1, p-MAPT, MAPT, Cleaved MAPT, MAP1LC3, and ACTB in inducible MAPT cells after transfection with si-VDAC1 (100 nM) for 48 h. The graph plots the quantification data is shown in (A). n = 3, *p < 0.05, **p < 0.01, ***p < 0.001. (B) Degradation of MAPT oligomers was visualized in MAPT-BiFC cells when cells were transfected with si-VDAC1 (100 nM) for 48 h. Scale bar: 20 μm. Quantification of data is shown in (B). Values are means ± SEM; n > 20 cells. ***p < 0.001. (C) Schematic summary of VDAC1-mediated autophagy modulation upon Sert treatment