Figures & data
Figure 1. Equine SAMHD1 restricts EIAV infection. (A) Knockdown of the protein expression levels of EfSAMHD1. eMDMs were transfected with EfSAMHD1-specific siRNA or scrambled siRNA control. At 48 hpt, EfSAMHD1 protein levels were quantified by western blotting using ACTB as an internal control. The densities of EfSAMHD1 bands were analyzed with the Odyssey CLx Image Studio to calculate the values relative to that of ACTB. Results were normalized to control cells, which were set as 1. (B) Knockdown of EfSAMHD1 increases EIAV replication in equine macrophages. eMDMs transfected with the indicated siRNA were infected with EIAV luciferase reporter virus (RT = 10 ng). Cells were lysed, and luciferase activity in the cell lysates was measured at 48 hpi. Results were normalized to control cells. P > 0.05 was considered NS, P < 0.05 was considered statistically significant. (C and D) Knockdown of EfSAMHD1 increases viral reverse transcription products in eMDMs. EIAV luciferase reporter viruses were first treated with DNase and then used to infect eMDMs. Total DNA was collected, and the viral early (C) and late reverse transcripts (D) were quantified by real-time PCR using specific primers at 6, 12 and 18 hpi. ACTB was measured as an endogenous control. Data represent means and SD of three independent experiments. P > 0.05 was considered NS, P < 0.05 was considered statistically significant. (E) Adding dNTPs into eMDMs enhances the infection of EIAV in a dose-dependent manner. eMDMs were exposed to deoxynucleosides at different concentration, and then infected with EIAV luciferase reporter virus. Cells were lysed, and luciferase activity in the cell lysates was measured at 48 hpi. Results were normalized to control cells, which were set as 1. Data represent means and SD of three independent experiments. P > 0.05 was considered NS, P < 0.05 was considered statistically significant. (F) HD domain of EfSAMHD1 is essential for its antiviral activity. Stable U937 cell lines expressing wild-type SAMHD1 or SAMHD1 mutants were inoculated with EIAV luciferase reporter viruses. Cells were lysed, and luciferase activity in the cell lysates was measured at 48 hpi. Results were normalized to control cells, which were set as 1. Data represent means and SD of three independent experiments. P > 0.05 was considered NS, P < 0.05 was considered statistically significant
Figure 2. EIAV Rev decreases equine SAMHD1 expression. (A) EIAV infection decreases levels of EfSAMHD1 expression at the protein level. eMDM cells were infected with EIAVDLV36 (RT = 200 ng). EfSAMHD1 protein levels were monitored at 12 and 24 hpi. Western blotting was performed with indicated antibodies. The densities of EfSAMHD1 bands were analyzed to calculate the values relative to that of ACTB. Results were normalized to uninfected cells as control group. (B) EIAV infection does not decrease levels of EfSAMHD1 mRNA. eMDM cells were infected with EIAVDLV36 (RT = 200 ng). EfSAMHD1 mRNA levels were monitored at 12 and 24 hpi. mRNA levels were analyzed using real-time PCR. Data represent means and SD of three independent experiments. P > 0.05 was considered NS, P < 0.05 was considered statistically significant. (C) EIAV infection decreases levels of EfSAMHD1 protein in a dose-dependent manner. eMDMs were mock-infected or infected with EIAVDLV36 for 24 h (RT = 200 ng; RT = 400 ng). (D) EIAV Rev decreases protein levels of EfSAMHD1. HEK293T cells were transfected with the indicated plasmids. Protein expression was analyzed using western blotting with indicated antibodies at 48 hpt. The densities of EfSAMHD1 bands were analyzed to calculate the values relative to that of ACTB. Results were normalized to control cells. (E) Immunoblot analysis of SAMHD1 expression from the EIAV Rev and SAMHD1mutant co-expression experiment. HEK293T cells were transfected with indicated plasmids. Protein expression was analyzed using western blotting with indicated antibodies at 48 hpt. The densities of SAMHD1 mutant bands were analyzed to calculate the values relative to that of ACTB. Results were normalized to respective control cells. (F) The effect of EIAV infection on different SAMHD1 mutants expression. EIAV with VSV-G (RT = 400 ng) was used to infect stable U937 cell lines expressing different SAMHD1 mutants. Protein expression was analyzed using western blotting with indicated antibodies at 48 hpi. The densities of SAMHD1 mutant bands were analyzed to calculate the values relative to that of ACTB. Results were normalized to respective control cells. (G) HIV-1 Rev does not decrease expression levels of EfSAMHD1 or huSAMHD1 proteins
Figure 3. EIAV Rev interacts with equine SAMHD1. (A) GST affinity-isolation analysis of EfSAMHD1 and Rev. Flag-SAMHD1 was co-transfected with VR-GST or Rev-GST. Whole-cells lysates were prepared, and GST affinity isolations were performed with glutathione magbeads and analyzed using western blotting. (B) Co-IP analysis of EfSAMHD1 and Rev. HEK293T cells were transfected with indicated plasmids. Whole-cell lysates were prepared at 48 hpt, and immunoprecipitations were performed with anti-Flag beads and analyzed using western blotting. (C) EIAV Rev relocalizes EfSAMHD1 from the nucleus to cytoplasmic compartments. Flag-EfSAMHD1 and Rev-HA were expressed individually or together in HeLa cells. Cells were fixed, permeabilized and incubated with primary and secondary antibodies at 36 hpt, EfSAMHD1 and Rev expression were observed using confocal microscopy. Scale bar: 5 μm. (D) Schematic of the BiFC fusion proteins. (E) Detection of EfSAMHD1 and Rev interaction using BiFC assay. VN-Flag-EfSAMHD1 and Rev-VC were expressed individually or together in HeLa cells and EfSAMHD1 and Rev fusion proteins were stained with rabbit anti-Flag or anti-HA polyclonal antibodies followed by Alexa Fluor 647-conjuated goat anti-rabbit antibodies. BiFC green fluorescent signals together with the expression of EfSAMHD1 or Rev expression were visualized using confocal microscopy. Scale bar: 5 μm. (F) HIV-1 Rev does not produce BiFC green fluorescent signals with EfSAMHD1. RevHIV-VC-HA was used as a negative control. Scale bar: 20 μm
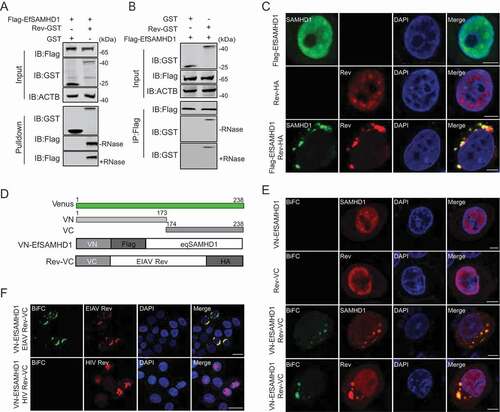
Figure 4. EIAV Rev promotes the lysosomal degradation of equine SAMHD1. (A) Lysosome pathway inhibitors block Rev-induced EfSAMHD1 degradation. HEK293T cells were transfected with indicated plasmids. At 20 hpt, cells were treated with MG132 (10 μM), 3-MA (5 mM), CQ (150 μM), Baf A1 (200 nM), or wortmannin (200 nM). After incubation for 16 h, the cells were analyzed using western blotting with indicated antibodies. The densities of SAMHD1 bands were analyzed to calculate the values relative to that of ACTB. Results were normalized to respective control cells. (B) EfSAMHD1 is targeted to lysosomes for degradation. VR1012-mcherry or VR1012-LAMP2-mcherry was expressed in HeLa cells with the VN-Flag-EfSAMHD1 and Rev-VC pair. Colocalization of these fluorescent signals was visualized by confocal microscopy. Scale bar: 5 μm. (C and D) Analysis of the effect of protein degradation inhibitors on the SAMHD1-Rev BiFC punctate number. VN-Flag-EfSAMHD1 and Rev-VC were co-expressed in HeLa cells. At 20 hpt, cells were further treated with indicated inhibitors. After Incubation for 16 h, the cells were observed using confocal microscopy (C). Scale bar: 20 μm. The number of SAMHD1-Rev BiFC puncta was statistically analyzed (D)
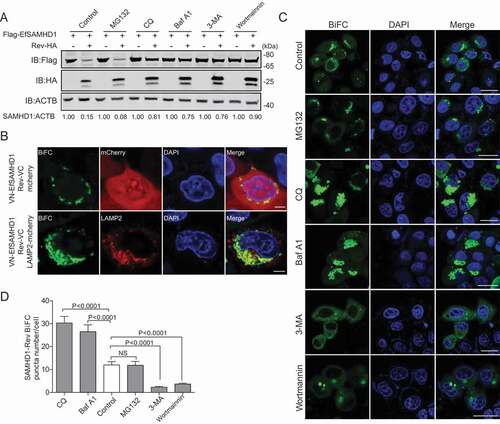
Figure 5. BECN1 is involved in Rev-mediated equine SAMHD1 degradation. (A) Yeast two-hybrid analysis of EfBECN1 and Rev. The indicated plasmids were co-transformed into the Y2HGold yeast strain. (B) GST affinity-isolation analysis of EfBECN1 and Rev. Flag-BECN1 was co-transfected with VR-GST or Rev-GST. Whole-cells lysates were prepared, and GST affinity isolations were performed with glutathione magbeads and analyzed using western blotting. (C) Co-IP analysis of EfSAMHD1 and Rev. HEK293T cells were transfected with indicated plasmids. Whole-cell lysates were prepared at 48 hpt, and immunoprecipitations were performed with anti-Flag beads and analyzed using western blotting. (D) Knockdown of EfBECN1 blocks EIAV-induced EfSAMHD1 degradation. eMDMs were transfected with BECN1-specific siRNA or scrambled siRNA control. At 48 hpt, eMDMs were infected with EIAVDLV36. BECN1 and EfSAMHD1 protein levels were visualized using western blotting after additional 24 h. The densities of EfSAMHD1 and BECN1 bands were analyzed to calculate the values relative to that of ACTB. Results were normalized to uninfected cells of control group. (E and F) BECN1 is recruited to the SAMHD1-Rev complex. (E) Flag-EfSAMHD1 was transiently expressed with or without Rev-HA in HEK293T cells. At 48 hpt, anti-Flag immune complexes were immunoblotted against endogenous BECN1 and ectopically expressed SAMHD1 and Rev. (F) Flag-BECN1 was co-transfected in HeLa cells with the VN-EfSAMHD1-HA and Rev-VC pair or with VN-EfSAMHD1-HA alone. Ectopic BECN1 was stained with rabbit anti-Flag antibodies, followed by Alexa Fluor 647-conjugated secondary antibodies. Colocalization of these fluorescent signals was visualized by confocal microscopy. Scale bar: 20 μm
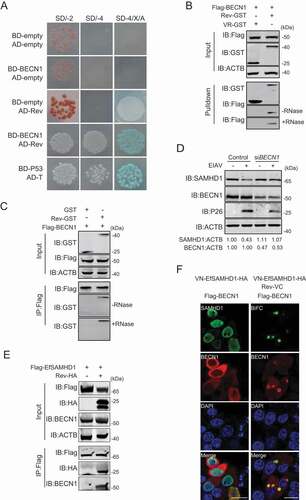
Figure 6. BECN1 and PIK3C3, but not all components of the autophagy pathway, are required for Rev-mediated equine SAMHD1 degradation. (A) Schematic overview of the lysosomal degradation related to BECN1. (B) EIAV infection does not trigger autophagy in eMDMs. eMDMs were mock-infected or infected with EIAVDLV36 for 12 h and 24 h (RT = 200 ng). Cells were washed three times with PBS and then cultured in EBSS medium for 2 h for inducing starvation as a positive control. eMDMs were treated with Baf A1 (50 nM) or DMSO for 6 h. The cell lysates were analyzed using western blotting. The densities of LC3 II bands were analyzed to calculate the values relative to that of ACTB. Results were normalized to the control cells with DMSO treatment at 12 hpi. (C) Overexpression of EIAV proviral DNA or Rev does not trigger autophagy. HEK293T cells were co-transfected with plasmids encoding EIAV proviral DNA and Rev for 36 h, and HEK293T cells starved in EBSS medium for 2 h were used as a positive control. HEK293T cells were treated with Baf A1 (200 nM) or DMSO for 6 h. The cell lysates were analyzed using western blotting. The densities of LC3 II bands were analyzed to calculate the values relative to that of ACTB. Results were normalized to the control cells with DMSO treatment. (D) Knockout of BECN1 or PIK3C3 genes block Rev-induced EfSAMHD1 degradation. WT and ATG KO HEK293T cells were transfected with indicated plasmids, the lysates were analyzed using western blotting. The densities of SAMHD1 bands were analyzed to calculate the values relative to that of ACTB. Results were normalized to respective control cells. (E) Detection of BiFC signals from the SAMHD1 and Rev co-expression in WT and ATG KO HEK293T cells. LAMP2-mCherry was expressed in WT and ATG KO HEK293T cells with the VN-EfSAMHD1-HA and Rev-VC pair. Colocalization of these fluorescent signals was visualized using confocal microscopy at 36 hpt. Scale bar: 5 μm
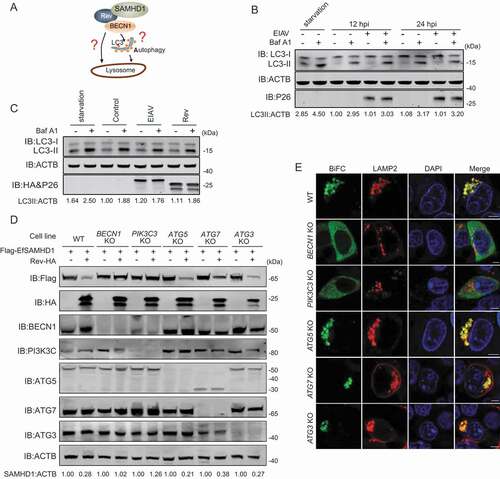
Figure 7. Identification of Rev domains crucial for equine SAMHD1 degradation. (A) Schematic diagram of wild-type EIAV Rev and structures of respective mutants. (B) Immunoblot analysis of EfSAMHD1 expression from the EfSAMHD1 and EIAV Rev mutant co-expression experiment. (C) Detection of BiFC green fluorescent signals from the EfSAMHD1 and EIAV Rev mutants co-expression experiment. HeLa cells were transfected with indicated plasmids. At 20 hpt, cells were either treated with LMB (5 nM) or not. After Incubation for 16 h, ectopic Rev proteins were stained with rabbit anti-HA antibodies, followed by Alexa Fluor 647-conjugated secondary antibodies. Colocalization of these fluorescent signals was visualized by confocal microscopy. Scale bar: 10 μm. (D) GST affinity-isolation analysis of EfSAMHD1 and EIAV Rev mutants. (E) GST affinity-isolation analysis of EfBECN1 and EIAV Rev mutants. (F) LMB blocks Rev-induced EfSAMHD1 degradation. HEK293T cells were transfected with indicated plasmid. At 20 hpt, cells were treated with LMB (5 nM) or not. After Incubation for 16 h, the cell lysates were analyzed by western blotting. The densities of SAMHD1 bands were analyzed to calculate the values relative to that of ACTB. Results were normalized to control cells
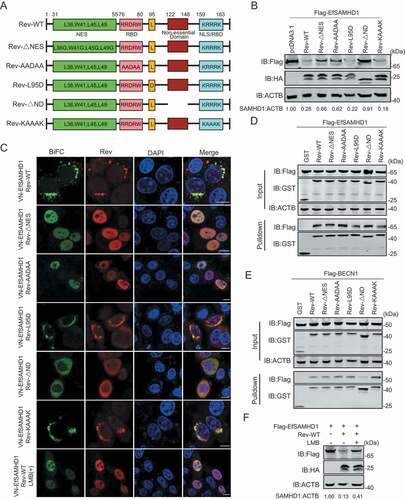
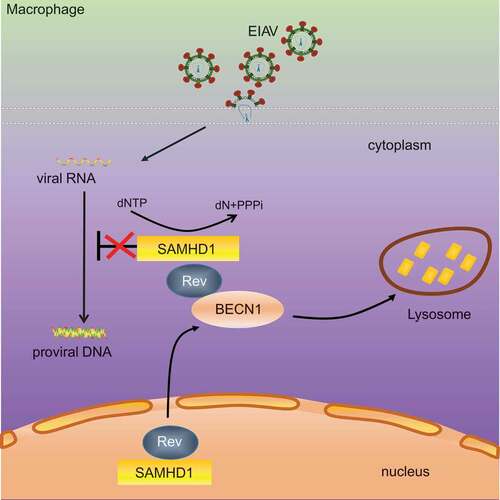
Figure 8. Schematic representation shows the model of Rev-mediated equine SAMHD1 degradation. Equine SAMHD1 limits EIAV replication by its dNTPase activity. However, EIAV Rev degrades equine SAMHD1 through a BECN1-dependent lysosome pathway to overcome equine SAMHD1 restriction