Figures & data
Figure 1. PARP14 is upregulated in the peri-infarct area after PT. (A-B) Representative immunoblots (A) and bar graph (B) showing western blot analysis of PAR levels in the peri-infarct cortex at day 1, 3, 7, and 14 after stroke. n = 4 animals/group. **P < 0.01 and ***P < 0.001 versus the Sham group using one-way ANOVA followed by the Holm-Sidak test. (C) qPCR analysis showing mRNA expression of each member of the PARP superfamily in the peri-infarct cortex at day 1, 3, 7, and 14 after stroke. n = 4 animals for the Sham group and n = 5 for the other groups. (D) Representative immunoblots and bar graph showing western blot analysis of PARP14 levels in the peri-infarct cortex at day 1, 3, 7, and 14 after stroke. n = 6 animals/group. *P < 0.05 and **P < 0.01 versus the Sham group using Welch ANOVA followed by Tamhane’s T2 post hoc test. (E) Confocal images showing immunostaining of PARP14 in the peri-infarct cortex at day 3 after stroke
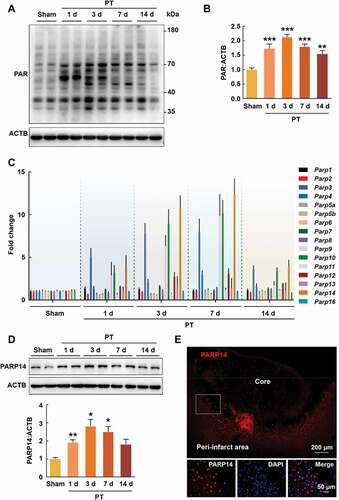
Figure 2. Knockdown of PARP14 after PT aggravates functional deficiency. (A) Schematic of experimental timeline. Lentivirus (LV; shRNA-Parp14 or shRNA-Con) was injected into the prospective stroke site in the cortex at day 3 prior to stroke. Behavioral performances were examined at baseline and day 3, 7, and 14 after stroke. (B) The expression of shRNA-Parp14 (GFP) at day 1 after stroke. Scale bar: 50 μm. (C) PARP14 level in the peri-infarct cortex at day 4 after shRNA-Con or shRNA-Parp14 infection. n = 6 animals/group. ##P < 0.01 versus the shRNA-Con group using one-way ANOVA followed by the Holm-Sidak test. (D-F) Functional recovery in mice was assessed via foot faults of the left forelimb in the grid-walking task (D), forelimb symmetry in the cylinder task (E), and (Left-Right) removal time in the adhesive removal test (F) at baseline and day 3, 7, and 14 after stroke. n = 10 animals for the Sham + shRNA-Con and Sham + shRNA-Parp14 groups, and n = 14 animals for the PT + shRNA-Con and PT + shRNA-Parp14 groups. *P < 0.05, **P < 0.01, and ***P < 0.001 versus the Sham + shRNA-Con group, and #P < 0.05 versus the PT + shRNA-Con group, using two-way repeated measures ANOVA followed by the Holm-Sidak post hoc multiple comparison test. (G) Representative Nissl-stained brain sections at day 14 after stroke from Vehicle, PT + shRNA-Con, and PT + shRNA-Parp14 groups, respectively. (H) Bar graph showing infarct volume from Vehicle, PT + shRNA-Con, and PT + shRNA-Parp14 groups, respectively. n = 8 animals/group. ##P < 0.01 versus the shRNA-Con group using one-way ANOVA followed by the Holm-Sidak test
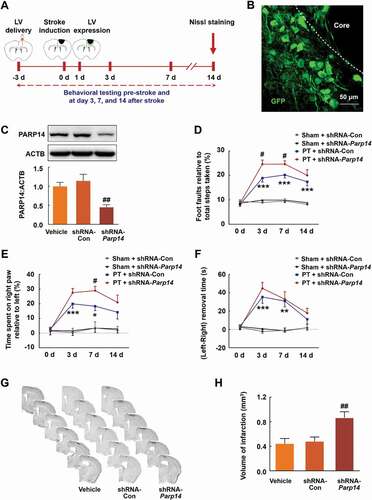
Figure 3. Inhibiting PARP14 after PT worsens functional impairment. (A) Structure of the PARP14 inhibitor H10. (B) Schematic of experimental timeline. H10 was injected into the peri-infarct cortex 2 h after stroke. Behavioral performances were examined at baseline and day 3, 7, and 14 after stroke. (C-E) Functional recovery in mice was assessed via foot faults of the left forelimb in the grid-walking task (C), forelimb symmetry in the cylinder task (D), and (Left-Right) removal time in the adhesive removal test (E) at baseline and day 3, 7, and 14 after stroke. n = 10, 11, 12, and 12 animals for the Sham + 0.005% dimethyl sulfoxide (DMSO), PT + 0.005% DMSO, PT + 1 μmol/L H10, and PT + 10 μmol/L H10 groups, respectively. *P < 0.05, **P < 0.01, and ***P < 0.001 versus the Sham + 0.005% DMSO group, and #P < 0.05 and ##P < 0.01 versus the PT + 0.005% DMSO group, using two-way repeated measures ANOVA followed by the Holm-Sidak post hoc multiple comparison test. (F) Representative Nissl-stained brain sections at day 14 after stroke from PT + 0.005% DMSO, PT + 1 μmol/L H10, and PT + 10 μmol/L H10 groups, respectively. (G) Bar graph showing infarct volume from PT + 0.005% DMSO, PT + 1 μmol/L H10, and PT + 10 μmol/L H10 groups, respectively. n = 6 animals/group. *P < 0.05 versus the PT + 0.005% DMSO group using one-way ANOVA followed by the Holm-Sidak test
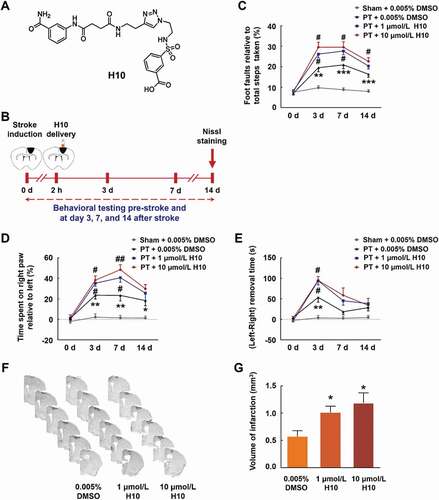
Figure 4. Overexpression of PARP14 after PT ameliorates functional deficiency. (A) Schematic of experimental timeline. Lentivirus (LV; LV-Parp14 or LV-Con) was injected into the prospective stroke site in the cortex 4 days prior to stroke. Behavioral performances were examined at baseline and day 3, 7, and 14 after stroke. (B) PARP14 level in the peri-infarct cortex at day 5 after LV-Con or LV-Parp14 infection. n = 6 animals/group. ##P < 0.01 versus the LV-Con group using one-way ANOVA followed by the Holm-Sidak test. (C-E) Functional recovery in mice was assessed via foot faults of the left forelimb in the grid-walking task (C), forelimb symmetry in the cylinder task (D), and (Left-Right) removal time in the adhesive removal test (E) at baseline and day 3, 7, and 14 after stroke. n = 10 animals for the Sham + LV-Con and Sham + LV-Parp14 groups, and n = 13 animals for the PT + LV-Con and PT + LV-Parp14 groups. *P < 0.05 and ***P < 0.001 versus the Sham + LV-Con group, and #P < 0.05 versus the PT + LV-Con group, using two-way repeated measures ANOVA followed by the Holm-Sidak post hoc multiple comparison test. (F) Representative Nissl-stained brain sections at day 14 after stroke from Vehicle, PT + LV-Con and PT + LV-Parp14 groups, respectively. (G) Bar graph showing infarct volume from Vehicle, PT + LV-Con and PT + LV-Parp14 groups, respectively. n = 8 animals/group. #P < 0.05 versus the LV-Con group using one-way ANOVA followed by the Holm-Sidak test
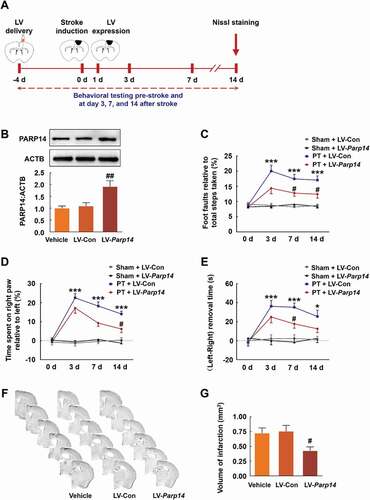
Figure 5. Inhibition of PARP14 after PT increases inflammatory response in the peri-infarct area. (A) Colocalization of GFAP, RBFOX3, or AIF1 (green) with PARP14 (red) in the peri-infarct cortex of mice. Scale bar: 50 μm. (B-C) Representative immunoblots (B) and bar graph (C) showing western blot analyses of RBFOX3, GFAP, and NOS2 expression in the peri-infarct cortex of mice at day 3 after PT under 1 μmol/L H10 treatment. n = 6 animals/group. **P < 0.01 and ***P < 0.001 versus the Sham + DMSO group, and ###P < 0.001 versus the PT + DMSO group, using two-way ANOVA followed by the Holm-Sidak test. (D-F) ELISA of the expression of TNF (D), IL1B (E), and IL6 (F) in the peri-infarct cortex of mice at day 3 after PT under 1 μmol/L H10 treatment. n = 7 animals/group. *P < 0.05 and ***P < 0.001 versus the Sham + DMSO group, and #P < 0.05 and ##P < 0.01 versus the PT + DMSO group, using two-way ANOVA followed by the Holm-Sidak test
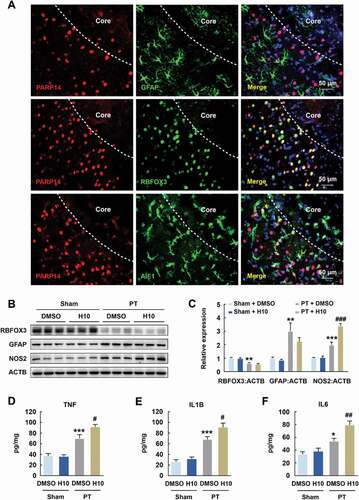
Figure 6. Inhibition of PARP14 after PT aggravates microglial activation in the peri-infarct area. (A-C) Representative images (A) and quantitative analyses (B and C) of immunostaining for AIF1 in the peri-infarct cortex of mice at day 3 after PT under 1 μmol/L H10 treatment. n = 6 animals/group. ***P < 0.001 versus the Sham + DMSO group, and #P < 0.05 versus the PT + DMSO group, using two-way ANOVA followed by the Holm-Sidak test. Scale bar: 50 μm. (D) M1-specific transcripts, M2a-specific transcripts, and M2c-specific transcripts in the peri-infarct cortex at day 3 after PT under 1 μmol/L H10 treatment. n = 8 animals for the Sham + DMSO and Sham + H10 groups, and n = 11 animals for the PT + DMSO and PT + H10 groups. ***P < 0.001 versus the Sham + DMSO group, and #P < 0.05 and ##P < 0.01 versus the PT + DMSO group, using two-way ANOVA followed by the Holm-Sidak test
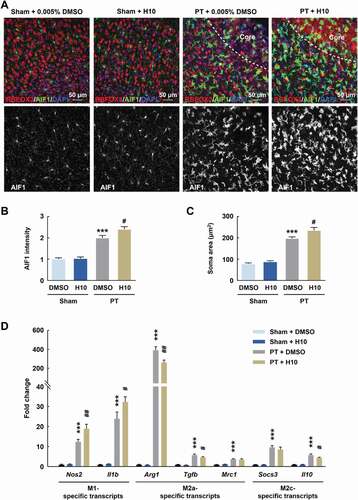
Figure 7. PARP14 modulates microglial activation after OGD. (A-C) Representative immunoblots (A) and bar graphs (B-C) showing western blot analyses of PARP14 (B) and NOS2 (C) levels in primary mouse microglia after OGD treatment for 3, 6, and 12 h. All data were obtained from 3 independent experiments. *P < 0.05, **P < 0.01, and ***P < 0.001 versus the Control group using one-way ANOVA followed by the Holm-Sidak test. (D) Transduction with shRNA-Parp14 increased NOS2 expression induced by OGD in primary mouse microglia. Cells were transduced with shRNA-Con or shRNA-Parp14 for 48 h and then treated with OGD for 6 h. All data were obtained from 3 independent experiments. **P < 0.01 versus the Con + shRNA-Con group, and ##P < 0.01 versus the OGD + shRNA-Con group, using two-way ANOVA followed by the Holm-Sidak test. (E) Treatment with H10 increased NOS2 expression induced by OGD in primary mouse microglia. Cells were treated with H10 or 0.005% DMSO and then subjected to OGD exposure for 6 h. All data were obtained from 3 independent experiments. *P < 0.05 versus the Con + DMSO group, and #P < 0.05 versus the OGD + DMSO group, using two-way ANOVA followed by the Holm-Sidak test. (F) Transfection with ACT-PARP14 attenuated the increased expression of NOS2 induced by OGD in primary mouse microglia. Cells were transfected with ACT-Con or ACT-PARP14 for 24 h and then treated with OGD for 6 h. All data were obtained from 3 independent experiments. **P < 0.01 versus the Con + ACT-Con group, and #P < 0.05 versus the OGD + ACT-Con group, using two-way ANOVA followed by the Holm-Sidak test
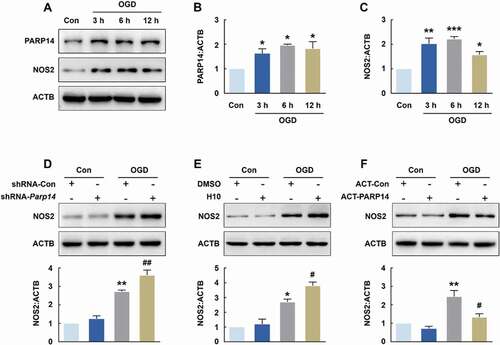
Figure 8. PARP14 induces autophagy to inhibit microglial activation after OGD. (A-C) Representative immunoblots (A) and bar graphs (B-C) showing western blot analyses of MAP1LC3B-II (B) and SQSTM1 (C) levels in primary mouse microglia after OGD treatment for 3, 6, and 12 h. All data were obtained from 3 independent experiments. *P < 0.05 and **P < 0.01 versus the Control group using one-way ANOVA followed by the Holm-Sidak test. (D) Transduction with shRNA-Parp14 attenuated the increased expression of MAP1LC3B-II induced by OGD in primary mouse microglia. Cells were transduced with shRNA-Con or shRNA-Parp14 for 48 h and then treated with OGD for 6 h. All data were obtained from 3 independent experiments. **P < 0.01 versus the Con + shRNA-Con group, and #P < 0.05 versus the OGD + shRNA-Con group, using two-way ANOVA followed by the Holm-Sidak test. (E) Transfection with ACT-PARP14 increased the expression of MAP1LC3B-II induced by OGD in primary mouse microglia. Cells were transfected with ACT-Con or ACT-PARP14 for 24 h and then treated with OGD for 6 h. All data were obtained from 3 independent experiments. ***P < 0.001 versus the Con + ACT-Con group, and ##P < 0.01 versus the OGD + ACT-Con group, using two-way ANOVA followed by the Holm-Sidak test. (F-G) PARP14 enhances autophagic flux after OGD. Primary mouse microglia were infected with mRFP-GFP-MAP1LC3B adenovirus and treated with OGD for 6 h. The numbers of yellow puncta and red puncta per cell were counted. All data were obtained from 4 independent experiments. ***P < 0.001 versus the Control group (autolysosome), #P < 0.05 and ###P < 0.001 versus the OGD group (autolysosome), †P < 0.05 versus the OGD group (autophagosome), and $P < 0.05 and $$P < 0.01 versus the OGD + CQ group (autophagosome), using one-way ANOVA followed by the Holm-Sidak test. Scale bar: 5 μm. (H) Pretreatment with Rap (1 μmol/L) for 1 h significantly decreased the expression of NOS2 induced by OGD in primary mouse microglia. All data were obtained from 3 independent experiments. **P < 0.01 versus the Control group, and ##P < 0.01 versus the OGD group, using two-way ANOVA followed by the Holm-Sidak test. (I) Pretreatment with 3-MA (1 mmol/L) for 1 h significantly increased the expression of NOS2 induced by OGD in primary mouse microglia. All data were obtained from 3 independent experiments. **P < 0.01 versus the Control group, and ##P < 0.01 versus the OGD group, using two-way ANOVA followed by the Holm-Sidak test
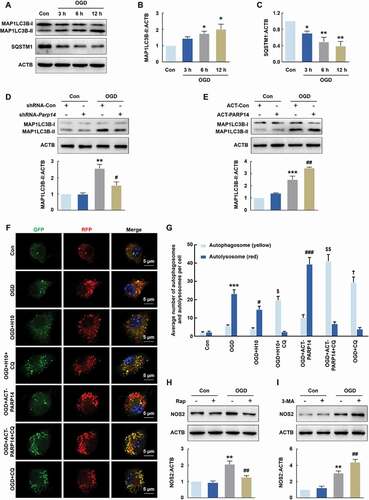
Figure 9. PARP14 suppresses microglial activation by downregulating LPAR5. (A) Heatmap of transcriptomes depicting differentially expressed genes determined by RNA sequencing in primary mouse microglia among different groups. Expression fold change > 2.0 and P < 0.05 for the OGD + ACT-Con group versus the Con + ACT-Con group and the OGD + ACT-PARP14 group versus the OGD + ACT-Con group. Orange color scale: higher expression. Blue color scale: lower expression. Each column represents one sample. All data were obtained from 2 independent experiments. (B-C) Transfection with ACT-PARP14 reversed the increased levels of Lpar5 mRNA (B) and LPAR5 (C) induced by OGD in primary mouse microglia. Cells were transfected with ACT-Con or ACT-PARP14 for 24 h and then treated with OGD for 6 h. All data were obtained from 4 (B) or 3 (C) independent experiments. **P < 0.01 and ***P < 0.001 versus the Con + ACT-Con group, and ##P < 0.01 and ###P < 0.001 versus the OGD + ACT-Con group, using two-way ANOVA followed by the Holm-Sidak test. (D) Representative immunoblots and bar graph showing western blot analysis of LPAR5 expression in the peri-infarct cortex of mice at day 3 after PT under 1 μmol/L H10 treatment. n = 6 animals/group. ***P < 0.001 versus the Sham + DMSO group, and ###P < 0.001 versus the PT + DMSO group, using two-way ANOVA followed by the Holm-Sidak test. (E) Level of Lpar5 mRNA after siRNA-Lpar5 transduction as measured by qPCR in primary mouse microglia. Cells were transduced with siRNA-Lpar5 for 48 h. All data were obtained from 3 independent experiments. ***P < 0.001 versus the siRNA-Con group. (F) Transduction with siRNA-Lpar5 attenuated the increased expression of NOS2 induced by OGD in primary mouse microglia. Cells were transduced with siRNA-Lpar5 for 48 h and then treated with OGD for 6 h. All data were obtained from 3 independent experiments. **P < 0.01 versus the Con + siRNA-Con group, and #P < 0.05 versus the OGD + siRNA-Con group, using two-way ANOVA followed by the Holm-Sidak test
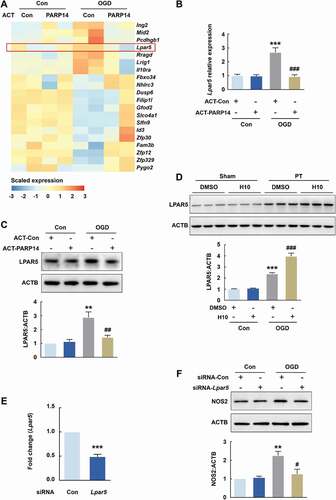
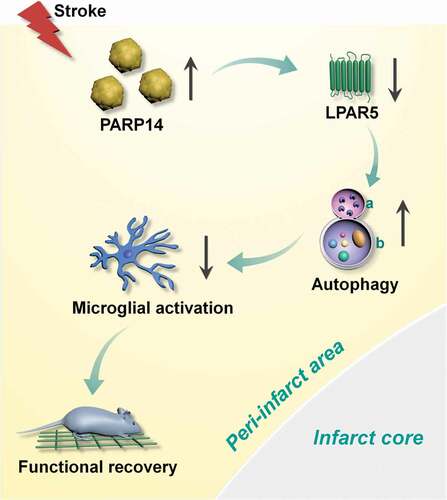
Figure 10. Schematic summary. Increased expression of PARP14 post stroke reduces the level of LPAR5 to aid autophagy and inhibit microglial activation, thereby promoting functional recovery. a: lysosome; b: autophagosome