
Figures & data
Figure 1. Generation of tecpr2 knockout mice as a model for SPG49. (A) Primary fibroblasts obtained from a healthy individual and SPG49 patients were lysed, and the extracted proteins immunoblotted for detection of TECPR2 by western blot analysis using anti-TECPR2 antibody. (B) TECPR2 mRNA levels in fibroblast cells from healthy individual and SPG49 patients. Total RNA from primary fibroblast cultures was extracted and subjected to quantitative RT-PCR using human TECPR2 primers. mRNA levels were normalized to the levels of HPRT1 (hypoxanthine phosphoribosyltransferase 1). Results are presented with the SEM of three independent experiments, p < 0.05, determined by one-way ANOVA with post-hoc Dunnett’s Multiple Comparison Test. The line at 1 refers to normalized mRNA levels in healthy control. (C) Primary fibroblasts derived from healthy individual and SPG49 patients were immunostained for TECPR2 and analyzed by confocal microscopy. Scale bar: 20 μm. (D) Schematic presentation of TECPR2 protein and its domains (top), and the expected DNA deletion and premature stop codon created by CRISPR-Cas9 using two short guiding RNA sequences (sgRNA). (E) Amino-acid sequence of wild-type TECPR2 and the truncated protein (p. Asp46Ilefs*4). (F) Representative genotyping PCR products of heterozygotic Tecpr2+/−, wild-type Tecpr2+/+ and tecpr2−/− knockout mice. (G) Mouse embryonic fibroblasts (MEFs) derived from wild-type and knockout mice were lysed, and the extracted proteins immunoblotted for detection of TECPR2 by western blot using anti-TECPR2 antibody. (H) Brain extracts from Tecpr2+/+ and tecpr2−/− mice were subjected to two-dimensional liquid chromatography followed by tandem mass spectrometry (2D-LC-MS/MS). The acquired tandem spectra (fragmentation spectra) were subjected to database searching for peptide and protein identification. Annotated MS2 spectrum identification of peptide VLLVSTLQR of TECPR2 by MaxQuant. Red: annotated peptide fragment, y-ion series. Blue: annotated peptide fragment, b-ion series (right panel). Extracted ion chromatogram for peptide VLLVSTLQR from fraction 3 of all samples were quantified by Skyline (left panel). Shown is the relative abundance of the peptide (“Peak Area Normalized”, y-axis) in each sample (“Replicate”, x-axis). Different colors represent different species of the isotopic packet of the precursor (Blue, M; Purple, [M + 1].; Brown, [M + 2].). (I) Immunostaining of TECPR2 in MEF cells derived from wild type Tecpr2+/+ and knockout tecpr2−/− mice. Scale bar: 20 μm. (J) Cervical segments of dorsal root ganglia (DRG) from wild-type Tecpr2+/+ and knockout tecpr2−/− adult mice were fixed with 4% PFA and embedded in paraffin. Slices (4-µm thick) were immunostained with anti-TECPR2 and anti-TUBB3 antibodies and DAPI. Scale bar: 50 μm
![Figure 1. Generation of tecpr2 knockout mice as a model for SPG49. (A) Primary fibroblasts obtained from a healthy individual and SPG49 patients were lysed, and the extracted proteins immunoblotted for detection of TECPR2 by western blot analysis using anti-TECPR2 antibody. (B) TECPR2 mRNA levels in fibroblast cells from healthy individual and SPG49 patients. Total RNA from primary fibroblast cultures was extracted and subjected to quantitative RT-PCR using human TECPR2 primers. mRNA levels were normalized to the levels of HPRT1 (hypoxanthine phosphoribosyltransferase 1). Results are presented with the SEM of three independent experiments, p < 0.05, determined by one-way ANOVA with post-hoc Dunnett’s Multiple Comparison Test. The line at 1 refers to normalized mRNA levels in healthy control. (C) Primary fibroblasts derived from healthy individual and SPG49 patients were immunostained for TECPR2 and analyzed by confocal microscopy. Scale bar: 20 μm. (D) Schematic presentation of TECPR2 protein and its domains (top), and the expected DNA deletion and premature stop codon created by CRISPR-Cas9 using two short guiding RNA sequences (sgRNA). (E) Amino-acid sequence of wild-type TECPR2 and the truncated protein (p. Asp46Ilefs*4). (F) Representative genotyping PCR products of heterozygotic Tecpr2+/−, wild-type Tecpr2+/+ and tecpr2−/− knockout mice. (G) Mouse embryonic fibroblasts (MEFs) derived from wild-type and knockout mice were lysed, and the extracted proteins immunoblotted for detection of TECPR2 by western blot using anti-TECPR2 antibody. (H) Brain extracts from Tecpr2+/+ and tecpr2−/− mice were subjected to two-dimensional liquid chromatography followed by tandem mass spectrometry (2D-LC-MS/MS). The acquired tandem spectra (fragmentation spectra) were subjected to database searching for peptide and protein identification. Annotated MS2 spectrum identification of peptide VLLVSTLQR of TECPR2 by MaxQuant. Red: annotated peptide fragment, y-ion series. Blue: annotated peptide fragment, b-ion series (right panel). Extracted ion chromatogram for peptide VLLVSTLQR from fraction 3 of all samples were quantified by Skyline (left panel). Shown is the relative abundance of the peptide (“Peak Area Normalized”, y-axis) in each sample (“Replicate”, x-axis). Different colors represent different species of the isotopic packet of the precursor (Blue, M; Purple, [M + 1].; Brown, [M + 2].). (I) Immunostaining of TECPR2 in MEF cells derived from wild type Tecpr2+/+ and knockout tecpr2−/− mice. Scale bar: 20 μm. (J) Cervical segments of dorsal root ganglia (DRG) from wild-type Tecpr2+/+ and knockout tecpr2−/− adult mice were fixed with 4% PFA and embedded in paraffin. Slices (4-µm thick) were immunostained with anti-TECPR2 and anti-TUBB3 antibodies and DAPI. Scale bar: 50 μm](/cms/asset/3af4d892-f3da-4bc3-9a03-2d5625e7a214/kaup_a_1852724_f0001_oc.jpg)
Figure 2. Tecpr2 knockout mice exhibit gait and sensory defects. Differences in walking patterns between Tecpr2+/+ and tecpr2−/− mice were analyzed using Noldus CatWalkXT software (WT, n= 21; KO, n= 28). (A) Left panel shows the step sequence distribution between Cruciate (CA, CB) and Alternate (AA, AB) sequences, as illustrated on the right panel. Limbs: LF, left front; LH, left hind; RF, right front; RH, right hind. (B) Base of support (BOS) analysis by CatWalk XT as in (A). Front paws (FP) and hind paws (HP) are shown in left and right panel, respectively. (C) Mouse proprioceptive abilities were evaluated on a pole task. Numbers of mice that successfully turned and climbed down (Climber) or failed to complete a turn on a vertical pole (Fall or Slide) are shown (WT, n= 10; KO, n= 18). Results were statistically analyzed by a t-test for A− D, and by a chi squared-likelihood ratio test for E * P< 0.05, ** P< 0.01, *** P< 0.001, **** P< 0.0001. (D) Response to mechanical-sensory stimuli was tested by the response of hindlimb paws to Von Frey hair filaments; the mechanical threshold for each mouse was calculated (WT, n= 17; KO, n= 29). (E) Response to noxious thermal stimuli was tested by paw withdrawal latency (PWL) in response to a heated probe (58°C) applied to hindlimb paws (WT, n= 16; KO, n= 26)
Figure 3. Neurodegeneration in tecpr2 knockout mice. (A) 4 to 5 months old tecpr2−/− and Tecpr2+/+ mice were anesthetized by isoflurane and subjected to brain MRI. The six regions of interest (ROIs) including pyramidal tract (py), genu of the facial nerve (g7), superficial gray layer of the superior colliculus (SuG), MVeMC medial vestibular nucleus, magnocellular part (MVeMC), supraoptic decussation (sox), and basal part of the cerebral peduncle (cp) were indicated with abnormalities characterized by significant elevation of T2 values in tecpr2−/− relative to Tecpr2+/+ mouse brains, summarized in a plot, *p < 0.05, t-test. (B) Nine-month-old mice were perfused with 4% PFA, and lumbar spine sections were taken, decalcified and embedded in paraffin. Then sections were cut and immunostained for neurofilament (red) and for myelin basic protein (MBP) (green). Scale bar: 100 µm, and scale bar of zoomed images 50 µm. Intensities are presented with the SEM of three different sections, ***p < 0.001, t-test. (C) Representative coronal section stained with H&E illustrating the affected sensory tract within the medulla oblongata of the brainstem: gracile nucleus (GrN), cuneate nucleus (CuN) and the caudal part of the spinal trigeminal nucleus (Sp5c). Scale bar: 500 µm. (D) tecpr2−/− and Tecpr2+/+ mice were perfused with 4% PFA and their brains were removed and embedded in paraffin. Sagittal brain sections of 9-month-old mice (4 µm thick) were stained with H&E, and their images were analyzed by widefield microscopy. Scale bar: 1000 µm, and scale bar of zoomed images, 50 µm. (E) TEM image indicates patterns of neurodegeneration in the tecpr2−/− mouse brain. Coronal brainstem section of tecpr2−/− mouse brain stem demonstrates swellings and abnormal axons. Scale bar: 5 µm. These structures were not identified in Tecpr2+/+ mice
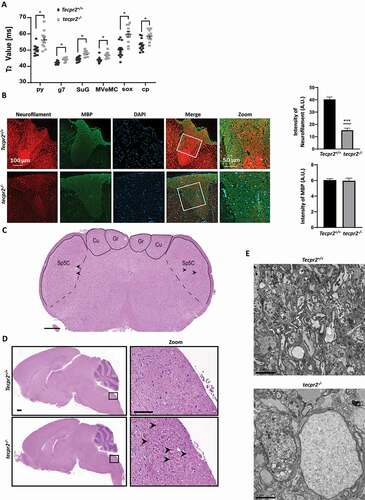
Figure 4. Accumulation of autophagosomes in tecpr2−/−mice. (A) TEM images indicate accumulation of double-membrane autophagic structures in a tecpr2−/− mice brain. Scale bar: 5 µm and scale bar of zoomed images, 1 µm (left) and 500 nm (right). (B) Total proteins extracted from the brains of Tecpr2+/+ and tecpr2−/− mice were analyzed by western blot for TECPR2, LC3B and SQSTM1 using corresponding antibodies. The levels of LC3B-II and SQSTM1 were calculated (right panel), results are presented with the SEM of three independent experiments, p < 0.05, determined by t-test. (C) Coronal brain sections from brainstem region, corresponding to spheroid areas in 9 months-aged mice, were immunostained for LC3 and SQSTM1 and analyzed by confocal microscopy. Scale bar: 20 μm. (D) Tecpr2+/+ and tecpr2−/− MEF cells were transfected with mRFP-GFP-LC3B construct using JetPrime transfection reagent for 24 h. Then cells were fixed with methanol and analyzed by confocal microscopy (left panel). Scale bar: 20 μm. The number of yellow and red dots per field represent autophagosomes or autolysosomes, respectively, was calculated and presented with the SEM ***p < 0.001, determined by t-test (right panel)
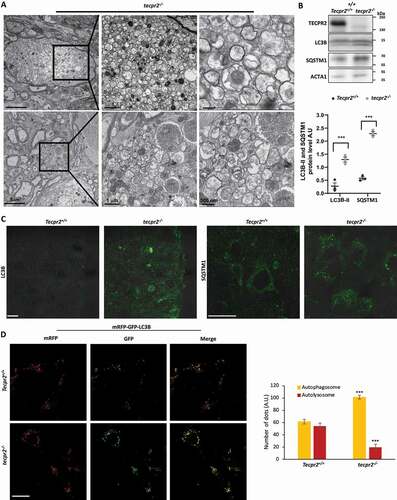
Figure 5. Isolation of autophagosomes from mouse brain and spinal cord. (A) Homogenates obtained from brains of 6 months-old Tecpr2+/+ and tecpr2−/− mice, floated over a sucrose gradient as described in Materials and Methods, fractions were subjected to western blot analysis with the indicated antibodies and bands were quantified by ImageJ software (lower panel). (B) Total homogenate and autophagosomes fractions isolated from brain and spinal cord of 6 months-old Tecpr2+/+ and tecpr2−/− mice were analyzed by western blot for TECPR2, LC3B, SQSTM1 and LAMP2 using corresponding antibodies. The intensity ratio of LC3B-II/LC3-I was calculated (upper panel), and results are presented with the SEM of three independent experiments for brain and spinal cord, ***p < 0.001, determined by t-test. SQSTM1 intensity was determined by densitometry (lower panel). Results are presented with the SEM of three independent experiments for brain and spinal cord, **p < 0.01, determined by t-test. (C) Total homogenate and autophagosomes fractions from brain and spinal cord of 6 months-old Tecpr2+/+ and tecpr2−/− mice were subjected to Proteinase K and Triton X-100 treatments as described in Materials and Methods. (D) Model of autophagosome accumulation in neurons of tecpr2−/− mice
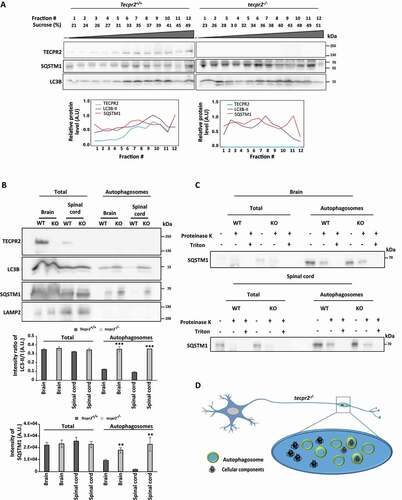
Figure 6. Age-dependent neurodegeneration in TECPR2−/− mice. (A) Age-dependent progressive formation of spheroids in the tecpr2−/− mouse brainstem. Tecpr2+/+ and tecpr2−/− mice (n = 3 for each experiment) aged 3, 6 and 9 months were perfused with 4% PFA and their brains were then removed and embedded in paraffin. Coronal brain sections obtained from similar areas of the brainstem were stained with H&E and analyzed by widefield microscopy. Number of spheroids was normalized to the size of the measured area (right panel). Scale bar of upper panel: 500 µm, scale bar of zoomed images: 50 µm. *p < 0.05, **p < 0.01 determined by one-way ANOVA with Dunnett’s Multiple Comparison Test as posttest. (B) Age-dependent progressive accumulation of LC3 in large autophagosomal structures in the brain affected regions of tecpr2−/− mice. Coronal brain sections from brainstem regions, corresponding to spheroid areas in mice aged 3, 6, and 9 months, were immunostained for LC3 (green) and analyzed by confocal microscopy. Scale bar: 20 µm. The intensity of LC3B was calculated by ImageJ and presented with the SEM * p < 0.05, **p < 0.01 determined by t-test (right panel)
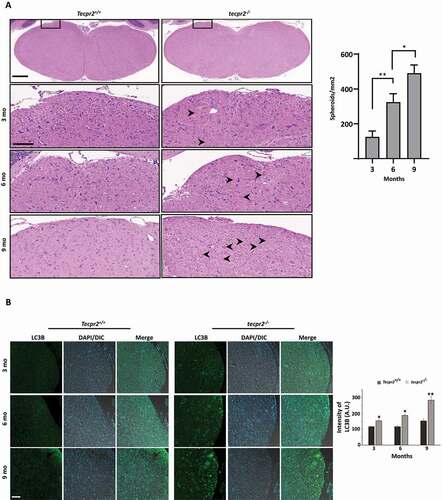
Table 1. Antibodies used in this study