Figures & data
Figure 1. Alternations during the disc degeneration in humans and rats. (A) Typical human MR T2-weighted images of grade II (left panel) and grade IV (right panel) IVD. The degenerated discs were indicated by white arrows. Scale bar: 5 cm. (B) General view of nucleus pulposus from donors who accepted nucleus pulposus discectomy surgery; Scale bar: 1 cm. The H&E and Safranin O-Fast Green staining of nucleus pulposus from human degenerated disc were shown on the right. Scale bar: 200 μm. (C) IHC staining of HIF1A in human nucleus pulposus sections. Scale bar: 200 μm. Quantitative analysis of HIF1A was shown as cells/mm2 (left panel) and positive rate (right panel). (D) IF staining of TEK and cleaved-CASP3 in human nucleus pulposus sections, the nucleus was labeled with DAPI, the region of nucleus pulposus was framed by dotted lines, the positive staining cells were indicated by white arrowheads. Scale bar: 200 μm. The positive rate of TEK and cleaved-CASP3 was shown in the statistical chart. (E) IHC staining of HIF1A and COL2A1 (collagen type II alpha 1 chain) in young and aged rat tissue sections. Positively stained cells were in brown. Scale bar: 200 μm. The expression level of COL2A1 was shown as the percentage of positively stained area, while HIF1A was quantified as positive rate (right panel). (F) IF staining of TEK and cleaved-CASP3 in rat tissue sections. Scale bar: 200 μm. The positive rate of TEK and cleaved-CASP3 was shown. Results were shown as mean ± SD. P value was calculated with t-test. *p < 0.05, *p < 0.01, ***p < 0.001
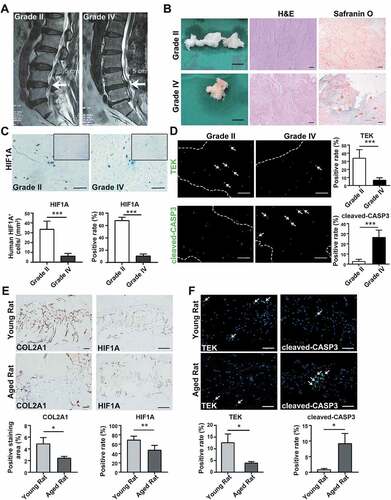
Figure 2. The characteristics of NPSCs under normoxia, CoCl2 mimicked hypoxia, and environmental hypoxia. (A) Colony formation test of four generations of NPSCs (P1 to P4). Scale bar: 2 cm. (B) Surface markers including CD90, CD73, CD44, CD34, and HLA-DR were detected with flow cytometry. The red curves indicated the percentage of labeled NPSCs and the gray curves represented the blank control. The positive rate of each surface marker was shown as the deviation between red curve and the blank control. (C) The multi-lineage differentiation potency of NPSCs (P1 and P4) and NPCs was assessed. Calcium nodules which were stained in red with Alizarin Red were demonstrated in NPSC after osteogenic induction (1st column). Scale bar: 100 µm. Lipid droplets in NPSC were stained in sepia with Oil Red O after adipogenic induction (2nd column). Scale bar: 200 µm. The monolayer of NPSC after chondrogenic differentiation induction produced glycosaminoglycan, which was stained in blue with Alcian Blue (3rd column). Scale bar: 100 µm. Micro pellets that were formed by 3D cultured NPSCs were cultured with chondrogenic differentiation medium, the section of which was stained with Safranin O (4th column). Scale bar: 50 µm. (D) Western blot analysis of NPSCs under hypoxia (1% O2) or normoxia (20% O2), and 10 μM or 100 μM CoCl2 for 12 h – 48 h. The protein TUBB (tubulin beta class I) was set as the internal reference. The elevation pattern of HIF1A in CoCl2 groups was similar to that of environmental hypoxia. (E) Densitometric analysis of HIF1A under different conditions. Results were shown as mean ± SD. ns, non-significant, p > 0.05; ###, comparing to the CoCl2 10 μM group, p < 0.001; ***, comparing to the 20% O2 group, p < 0.001. (F) The cell viability of NPSCs treated with different concentrations of CoCl2. ns, non-significant
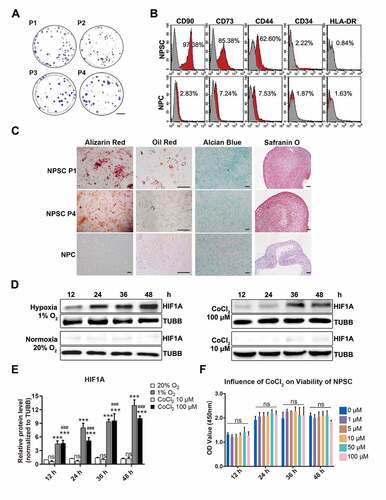
Figure 3. The anti-apoptotic effect of HIF1A in compression-induced apoptosis. (A) The cell viability of NPSC treated with compression and different concentrations of CoCl2 for 12, 24, 36, and 48 h. (B) FCM results of ANXA5/Annexin V-PI staining of NPSCs treated with 48-h compression and different concentrations of CoCl2. The apoptosis rate was the sum of the proportion of ANXA5+ PI− and ANXA5+ PI+ cells. Results were shown as mean ± SD. ns, non-significant, p > 0.05; *, compared to the Ctrl group; #, compared to the compression (CMP) group. *,#, p < 0.05; **,##, p < 0.01; ***, ###, p < 0.001. (C) Western blot analysis of NPSCs treated with 48-h compression and different concentrations of CoCl2. (D) The JC-1 probe staining of NPSCs treated with 48-h compression and different concentrations of CoCl2. Scale bar: 200 μm. (E) The cell viability of NPSCs treated with CHT followed by 100 μM CoCl2 (hypoxia mimicry, HX) and 48-h compression. The 0.01% dimethyl sulfoxide (DMSO; Sigma-Aldrich, D2650) in DMEM/F12 was used as vehicle controls. ***, compared to CMP group, p < 0.001; ###, compared to HX group, p < 0.001; ^, compared to HX+vehicle group, ^^^p < 0.001. (F) FCM results of ANXA5/Annexin V-PI staining of NPSCs treated with CHT, CoCl2, and 48-h compression (left). The apoptosis rate was shown as mean ± SD (right). (G) Blots and densitometric analysis of apoptosis-related proteins in NPSCs treated with CHT, CoCl2, and 48-h compression. Data was shown as mean ± SD. *, compared to CMP group. ns, non-significant; *p < 0.05, **p < 0.01, ***p < 0.001
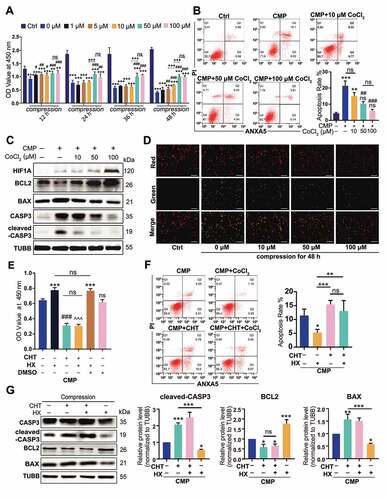
Figure 4. HIF1A upregulates autophagy in NPSC under compression. (A) TEM analysis of NPSC under different conditions: Ai. NPSC without compression or CoCl2; Aii. NPSC exposed to 48-h compression (CMP); Aiii. NPSC treated with 100 μM CoCl2 (Hypoxia mimicry, HX) during the 48-h compression. The double-membrane vesicles were autophagosomes, indicated by white arrows, while the single-membrane vesicles, which were autolysosomes, were pointed by black arrows. (B) IF of MAP1LC3B/LC3B (here after LC3B) in NPSCs under different conditions. Scale bar: 20 μm. (C) Data showed 10–90 percentile and mean of puncta area percentage in Ctrl, HX, CMP, and CMP+HX groups, analyzed by Kruskal-Wallis test. n = 120 cells from 3 independent experiment. (D) Western blot analysis of autophagy-related proteins in NPSCs treated with CoCl2 and 48-h compression. (E) Densitometric analysis of autophagy-related proteins. ns, non-significant; ***, compared to the Ctrl group, p < 0.001. (F) Densitometric analysis of the fold change of LC3B-II:I before and after inhibiting autophagic degradation with BafA1. *, compared to NX+BafA1 group, p < 0.05; ns, non-significant, compared to NX+BafA1 group; #, compared to CMP+BafA1 group, p < 0.05. (G) Western blot analysis of LC3B-II:I in cells treated with or without hypoxia mimicry (HX), with or without compression. BafA1 was added in the last 4 h. (H) Representative fluorescence images showing the autophagosomes (yellow dots, GFP+ RFP+) and autolysosomes (free red dots, GFP− RFP+) in AdV-mRFP-GFP-LC3 transfected NPSCs. Scale bar: 10 μm. (I) Quantification of the number of autophagosomes and autolysosomes per cell was shown as mean ± SD. Cells were from 3 independent experiments. ns, non-significant; ***p < 0.001. (J) Western blot analysis of autophagy-related proteins in NPSCs under compression and hypoxia treated with CHT. (K) Densitometric analysis of autophagy-related proteins when CHT was added. ns, non-significant; *, compared to CMP group, *p < 0.05, **p < 0.01, ***p < 0.001
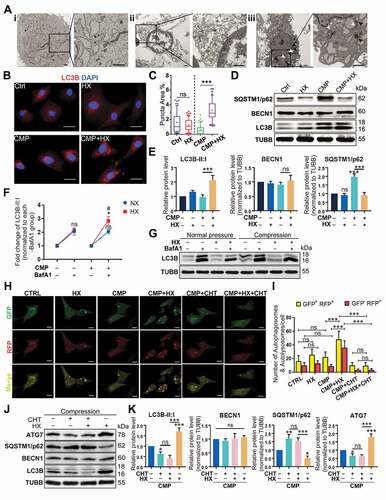
Figure 5. The anti-apoptotic effect of HIF1A relies on up-regulating autophagy. (A) Cell viability of NPSCs treated with compression, hypoxia (HX), and 3-MA. *, compared to CMP group. (B) FCM analysis of NPSCs treated with compression, hypoxia, and 3-MA. The apoptosis rate was shown in the statistical chart (right). (C) Western blot analysis of apoptosis and autophagy-related proteins with the treatment of 3-MA. (D) Densitometric analysis of key proteins related to apoptosis (cleaved-CASP3) and autophagy (LC3B) was shown in the statistical chart. Other protein data was shown in Fig. S3. (E) Cell viability of NPSCs transfected with siNC or siAtg7 under compression and hypoxia. (F) FCM analysis of siNC or siAtg7 transfected NPSCs treated with compression and hypoxia. The apoptosis rate was shown in the statistical chart (right). (G)Western blot analysis of apoptosis and autophagy-related proteins with the treatment of siAtg7. (H) The densitometric analysis of key proteins in autophagy and apoptosis was shown in the statistical chart. ns, non-significant; *, compared to CMP group; *p < 0.05, **p < 0.01, ***p < 0.001
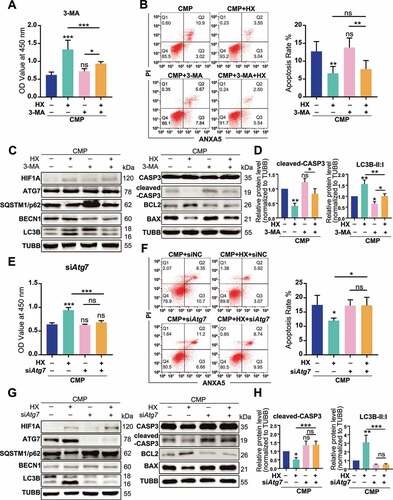
Figure 6. Overexpressing HIF1A induces autophagy activation and alleviates apoptosis of NPSCs under compression. (A) Ad-RFP-LC3 was used to label and detect LC3. After Ad-RFP-LC3 transfection, Lv-HIF1A-NPSC or Lv-NC-NPSC and followed by 48-h compression, the autophagy level was detected (above) and quantified (bottom). ***p < 0.001; Scale bar: 20 μm. (B) TUNEL staining of Lv-HIF1A-NPSC or Lv-NC-NPSC under compression. Transfected cells displayed green fluorescence, and TUNEL positive cells were emitting red fluorescence. Scale bar: 100 μm. The positive rate of TUNEL staining was shown in the subjacent chart. *p < 0.05. (C) Western blot analysis of key proteins in apoptosis and autophagy. Cells were transfected with Lv-HIF1A-GFP or Lv-NC-GFP and cultured with or without compression. Densitometric analysis was shown in the subjacent statistical chart. ns, non-significant; *, compared to the Lv-NC-NPSC group, **p < 0.01, ***p < 0.001. (D) Western blot analysis of key proteins related to apoptosis and autophagy in Lv-HIF1A-NPSC or Lv-NC-NPSC, which were transfected with siAtg7 or siNC. Densitometric analysis was shown in the right statistical chart. *, compared to the Lv-HIF1A-NPSC+CMP group, *p < 0.05, **p < 0.01, ***p < 0.001. (E) TUNEL staining (red signal) of Lv-HIF1A-NPSC or Lv-NC-NPSC transfected with siAtg7 or siNC under compression. Scale bar: 50 μm. The positive rate of TUNEL staining was shown in the right chart. ns, non-significant; *, compared to the Lv-NC-NPSC+CMP group, *p < 0.05, **p < 0.01, ***p < 0.001
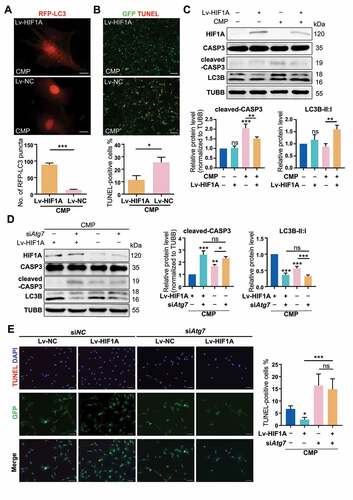
Figure 7. Quantitative proteomic analysis reveals the proteins that mediate the autophagy-stimulating effect of HIF1A. (A) Heatmap depicting the expression profiling of the 51 DEPs in the comparison between CMP+HX and CMP group. (B) GO enrichment analysis (biological processes and cellular component) of DEPs illustrating the gene count (indicated by the lines) and the adjusted hypergeometric p values (indicated by the bars). (C) GSEA of the FC-ranked DEP list showing the normalized enriched scores (NES) and the Kolmogorov–Smirnov p values for each predefined KEGG gene sets. Several interested proteins shown in the ranked list metric part were highlighted with the color same as their correlated pathways. (D) The PPI networks for DEPs and several related proteins. ATG7 was proved significantly upregulated by hypoxia (Figure 5 G) but excluded from DEPs due to p > 0.05. The thickness of connecting lines indicated the PPI confidence scores (values>0.4) according to the database STRINGv11. Node colors indicated the logFC values of DEPs. Hub DEPs, ranking the top in the list of connection degree that was generated by the Cytoscape plugin cytoHubba, were shown in nodes with bold borders
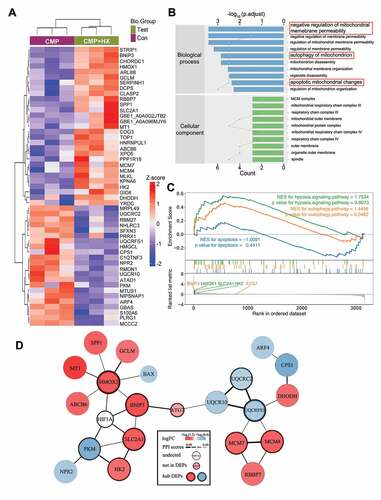
Figure 8. Knocking down of BNIP3, HMOX1, or SLC2A1 inhibits the autophagy-stimulation and the anti-apoptotic effects of hypoxia. (A) Western blot analysis of identified hub proteins (BNIP3, HMOX1, and SLC2A1), autophagy-related, and apoptosis-related proteins. Cells were transfected with siBnip3, or siHmox1, or siSlc2a1 or siNC, and then cultured under compression, with or without hypoxia mimicry. (B) Densitometric analysis of LC3B-II:I, ATG7, and cleaved-CASP3 was shown in the statistical charts. Other proteins analysis was shown in Fig. S5E. ns, non-significant; *, compared to CMP+siNC group; *p < 0.05, **p < 0.01, ***p < 0.001. (C) Representative fluorescence images showing the autophagosomes (yellow dots, GFP+ RFP+) and autolysosomes (free red dots, GFP− RFP+) in AdV-mRFP-GFP-LC3 transfected NPSCs treated with siRNA or siNC under CMP (above) or CMP+HX (below) conditions. Scale bar:10 μm. (D) Quantification of the number of autophagosomes and autolysosomes per cell was shown as mean ± SD. Cells were from 3 independent experiments. ns, non-significant; *p < 0.05, **p < 0.01, ***p < 0.001
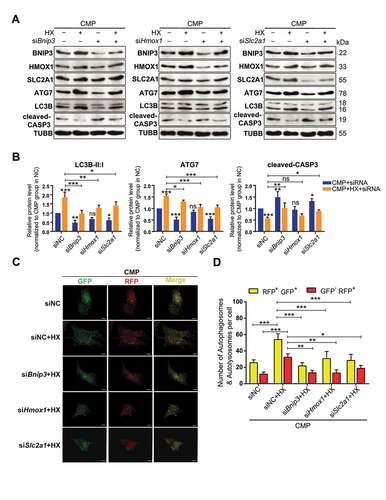
Figure 9. HIF1A overexpressed NPSCs retards IDD in vivo. (A) Typical image showing the rat IDD model, photographed by X-Ray after the operation. The white arrowheads indicated the compressed disc. Scale bar: 1 cm. (B) Schematic diagram explaining the workflow and the group settings of animal experiments. The IDD model rats on the 7th day post-surgery were randomly divided into five groups (n = 20 for each group). Near infra-red (NIR) in-vivo imaging was conducted for those underwent intra-disc transplantation. (C) NIR signals emitted from the transplanted cells were visualized at 1, 3, 7, and 14 days after intra-disc transplantation. The correlation between color and the intensity of the image was shown in the right panel. (D) The dynamics of the relative ratio of NIR net intensity (data aligned according to the 1st day image) of each group was shown in the statistical chart. Results were shown as mean ± SEM. ***, compared to the Lv-NC-NPSC group, p < 0.001; ###, compared to the NPSC group, p < 0.001. (E) IF staining of LC3B (The left panel: general view of disc sections for each group, the dotted lines indicated the border of NP, scale bar: 200 μm; Red: anti-LC3B. Green: anti-GFP. Blue: DAPI; The right panel: Representative images of LC3B staining, scale bar: 20 μm), cleaved-CASP3 (the positive cells were indicted by the white arrows, scale bar: 50 μm) and ACAN (scale bar: 50 μm) in the disc of each group. (F) The expression level of LC3B and cleaved-CASP3 was shown in the statistical chart. Implanted NPSC (GFP+) and host cells (GFP−) were respectively analyzed. For the statistical charts from at least 3 independent experiments, results were shown as mean ± SD. ns, non-significant; *, compared to Lv-HIF1A-GFP+-NPSC group, *p < 0.05, **p < 0.01, ***p < 0.001. (G) The expression level of ACAN was shown in the statistical chart. ns, non-significant; *, compared to Lv-HIF1A-NPSC group, *p < 0.05, **p < 0.01, ***p < 0.001. (H) Representative pictures of H&E and Safranin O-Fast Green staining of each transplantation group at 21 days after transplantation. The black dotted lines showed the region of transplanted cells (upper right). Scale bar: 500 μm. (I) Histological degenerative scores at 7, 14, and 21 days after intra-disc transplantation. ns, non-significant; *, compared to Lv-HIF1A-NPSC group; #, compared to Lv-NC-NPSC group; ^, compared to the NPSC group. *p < 0.05; **p < 0.01; ###, ^^^, ***, p < 0.001
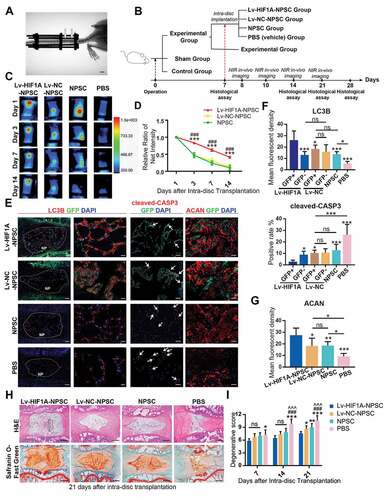
Figure 10. Strategies based on NPSC transplantation therapy for retarding IDD and restoring disc homeostasis