Figures & data
Figure 1. Protein expression profiles of MAP1LC3B-II, SQSTM1, GPX4, and SLC7A11 in cancer cell lines. (A) Schematic representation of western blot and detection procedures. Sixty cancer cell lines were treated with erastin (20 µM) or RSL3 (0.5 µM) in the absence or presence of chloroquine (CQ, 50 µM) for 3 and 6 h. We collected protein from each cell line in 3 biologically independent samples and mixed them together for western blot analysis. (B) Protein profile of MAP1LC3B-II, SQSTM1, GPX4, and SLC7A11 levels in response to erastin or RSL3 in the indicated cancer cell lines (data are shown in a heat map as the mean of biologically independent samples). The original western blot data are shown in Fig. S1. The relative intensities of the bands from western blots were analyzed and normalized to loading controls using ImageJ software. The cutoffs (P < 0.05) were set to a 25% change in relative intensity compared to the untreated group. Downregulation = relative intensity change of <0.75-fold; upregulation = relative intensity change of >1.25-fold. (C) The frequency assay of the level of MAP1LC3B-II, SQSTM1, GPX4, and SLC7A11 in response to erastin or RSL3 in 60 cancer cell lines (n = 3 biologically independent samples). The cutoffs (P < 0.05) were set to a 25% change in relative intensity compared to the untreated group. Downregulation = relative intensity change of <0.75 fold; upregulation = relative intensity change of >1.25-fold. Yes = changed percentage in 60 cancer cell lines; No = unchanged percentage in 60 cancer cell lines; Yes + No = 100%. (D) The frequency assay of the effects of CQ on the protein level of MAP1LC3B-II, SQSTM1, GPX4, and SLC7A11 in response to erastin or RSL3 in 60 cancer cell lines (n = 3 biologically independent samples). The cutoffs (P < 0.05) were set to a 25% change in relative intensity compared to the untreated group. Downregulation = relative intensity change of <0.75-fold; upregulation = relative intensity change of >1.25-fold. Downregulation + no change + upregulation = 100%
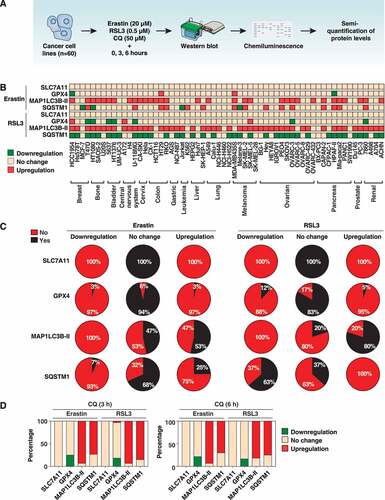
Figure 2. Relationship between protein level of MAP1LC3B-II with SQSTM1, GPX4, and SLC7A11 in 60 cancer cell lines (n = 3 biologically independent samples). The Pearson correlation coefficient was used to assay the relationship between the indicated two proteins under the indicated conditions after quantifying the intensity of protein bands from western blots
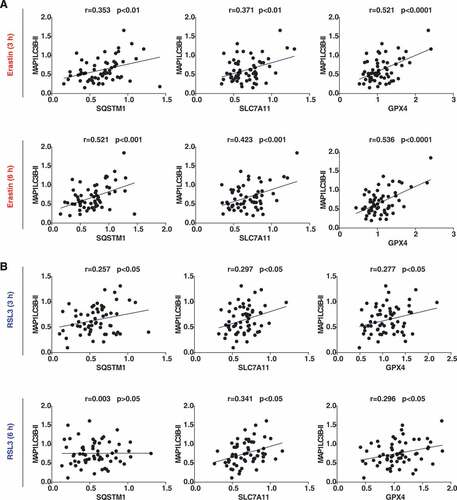
Figure 3. The role of autophagy in mediating ferroptosis. (A, B) The indicated cancer cell lines were treated with erastin (20 µM) or RSL3 (0.5 µM) in the absence or presence of chloroquine (CQ, 50 µM) for 6 h and then cell death (A) and lipid peroxidation (B) were assayed using propidium iodide (PI) or linoleamide alkyne (LAA) staining, respectively. A representative western blot, PI, or LAA image is shown (bar: 50 μm). Data are shown in a heat map as the mean of biologically independent samples. (C) Western blot analysis of ATG5, ATG7, or ATG4B expression in indicated gene knockdown HT1080 and PANC1 cells. (D, E) Analysis of cell death (D) and lipid peroxidation (E) in the indicated control and autophagy-deficient cells following treatment with erastin (20 µM) or RSL3 (0.5 µM) for 6 h (n = 3 biologically independent samples; *P < 0.05 versus control shRNA group). (F) Analysis of colocalization between MAP1LC3B (shown in green) and LAMP1 (shown in red) in PANC1 cells following treatment with RSL3 (0.5 µM) for 3–12 h (n = 10 random fields; *P < 0.05 versus control group; bar: 15 µm)
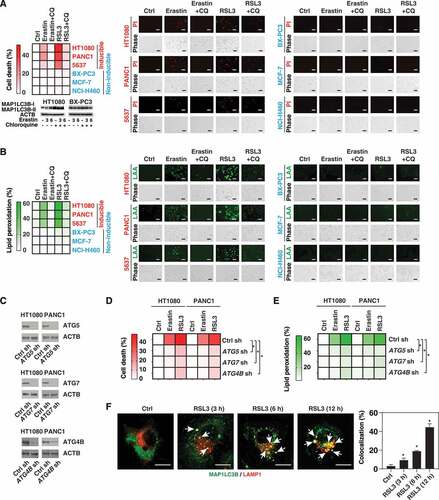
Figure 4. MAP1LC3B-II–inducible ovarian cancer cell lines are sensitive to ferroptosis. (A-C) Heatmap of the levels of MAP1LC3B-II (A), cell death (B), and lipid peroxidation (C) in 10 ovarian cancer cell lines following treatment with erastin (20 µM) or RSL3 (0.5 µM) for 6 h (data are shown as the mean of 3 biologically independent samples). (D, E) Analysis of cell death (D) and lipid peroxidation (E) in PEO4 and SKOV3 cells following treatment with erastin (20 µM) or RSL3 (0.5 µM) in the absence or presence of chloroquine (CQ, 50 µM) for 6 h (n = 3 biologically independent samples; *P < 0.05 versus erastin or RSL3 group)
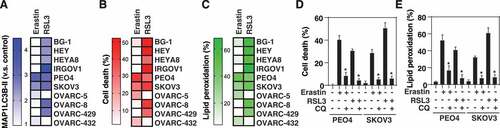
Figure 5. Autophagy mediates SLC40A1 degradation during ferroptosis. (A) Analysis of iron metabolism-related protein expression in the indicated HT1080 cells following treatment with erastin (10 µM) for 12 h (n = 3 biologically independent samples; *P < 0.05). (B, C) HT1080 cells were treated with erastin (10 µM) in the absence or presence of the indicated autophagy inhibitors (CQ, 50 μM; bafilomycin A1, 100 nM) or proteasome inhibitors (MG132, 0.5 μM; carfilzomib, 25 nM) for 12 h and then the protein expression of SLC40A1 was assayed (n = 3 biologically independent samples; *P < 0.05). (D) Immunoprecipitation (IP) assay of the interaction between SLC40A1 and the indicated autophagy receptors in HT1080 cells following treatment with erastin (10 µM) for 6 h (n = 3 biologically independent samples; *P < 0.05). (E) Analysis of SLC40A1 protein expression in the indicated HT1080 or PANC1 cells following treatment with erastin (10 µM) for 12 h (n = 3 biologically independent samples; *P < 0.05)
Figure 6. SLC40A1 contributes to ferroptosis resistance. (A) Analysis of erastin-induced cell death in control or erastin-resistant PANC1 cells (PANC1R) (n = 3 biologically independent samples; *P < 0.05 versus PANC1 group). (B) Analysis of the indicated protein expression in PANC1 and PANC1R cells. (C) Analysis of ATG5 and SLC40A1 protein expression in control, ATG5-overexpression, or SLC40A1-knockdown PANC1R cells. (D-F) Indicated PANC1R cells were treated with erastin (20 µM) for 12 and 24 h, and cell death (D), intracellular iron (E), and intracellular lipid peroxidation (F) were assayed (n = 3 biologically independent samples; *P < 0.05). (G) Analysis of SLC40A1 protein expression in control and SLC40A1-knockdown PANC1 cells. (H-J) The indicated PANC1 cells were treated with erastin (20 µM) in the absence or presence of liproxstatin-1 (“Lip1,” 500 nM), deferoxamine (“DFO,” 10 μM), or Z-VAD-FMK (“ZVAD,” 10 μM) for 12 h and then cell death (H), intracellular iron (I), and intracellular lipid peroxidation (J) were assayed (n = 3 biologically independent samples; *P < 0.05 versus erastin alone group)
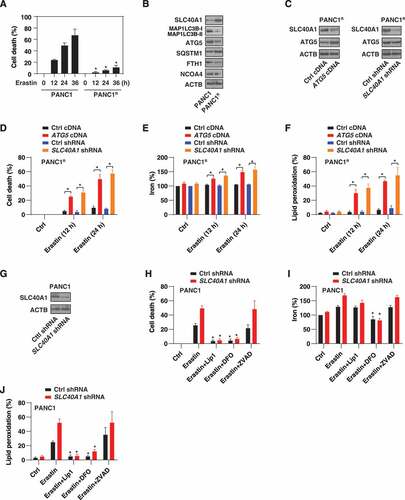
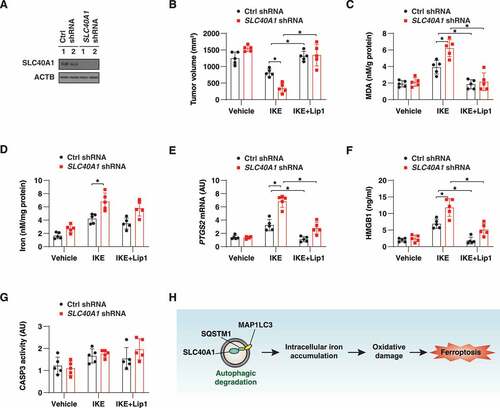
Figure 7. Knockdown of SLC40A1 promotes ferroptotic cell death in vivo. (A) Athymic nude mice were injected subcutaneously with control or SLC40A1-knockdown PANC1 cells for 1 week, and then treated with IKE (40 mg/kg, i.p., once every other day) in the absence or presence of liproxstatin-1 (Lip1, 10 mg/kg, i.p., once every other day) at day 7 for 3 weeks. Western blot analysis of SLC40A1 expression in isolated tumors from control shRNA and SLC40A1 shRNA groups at day 21. (B-G) At day 21 after treatment, tumor volume (B), MDA (C), iron (D), and PTGS2 mRNA (E) in isolated tumors and serum HMGB1 (F) were assayed (n = 5 mice/group; *P < 0.05). (G) In parallel, CASP3 activity in isolated tumors was assayed (n = 5 mice/group). (H) Schematic representation of autophagic degradation of SLC40A1 in promoting intracellular iron accumulation and subsequent oxidative damage-mediated ferroptosis