
Figures & data
Figure 1. Ssn2/Med13 is degraded via vacuolar proteolysis following nitrogen starvation. (A) Model outlying how the cyclin-dependent kinase 8 module (CKM) of the mediator complex is disassembled following stresses that mediate cell death or survival pathways. Before stress Ssn8/Cnc1/cyclin C (CC), Ssn3/Cdk8, Ssn2/Med13 and Srb8/Med12 form the CKM that predominantly represses stress response genes (SRGs) [Citation21,Citation22]. Repression is relieved after oxidative stress and nitrogen depletion by CKM disassembly, mediated by different mechanisms. After oxidative stress, Ssn2/Med13 is destroyed by the UPS [Citation32,Citation33], which allows Ssn8/Cnc1 localization to the mitochondria where it triggers stress-induced mitochondrial fission and promotes cell death [Citation27]. In contrast, following nitrogen starvation, Ssn8/Cnc1 is rapidly destroyed by the UPS before its nuclear release to prevent mitochondrial fission [Citation20] whereas the fate of Ssn2/Med13 is the subject of this current manuscript. (B) Western blot analysis of extracts prepared from wild-type cells expressing endogenous Ssn2/Med13-9xMYC (RSY2211) resuspended in nitrogen starvation medium (SD-N) or treated with 200 ng/ml rapamycin for the indicated times. (C) As in B except that endogenous Ssn2/Med13 protein levels were monitored in ump1∆ (RSY1961, Ssn2/Med13-13xMYC) and pep4∆ prb1∆.1 (RSY2215) strains. (D) Degradation kinetics and half-life of Ssn2/Med13 protein levels obtained in B and C. Error bars indicate S.D., N = 3 of biologically independent experiments. (E) Wild-type (RSY10) or pep4∆ prb1∆.1 (RSY449) cells expressing Ssn2/Med13-GFP (pSW218) were starved for nitrogen for indicated times. For all cleavage assays, free GFP refers to the protease resistant GFP moiety that accumulates after the full-length fusion protein is degraded via the vacuole. GFP accumulation was monitored by western blot analysis using anti-GFP antibodies. An asterisk indicates a nonspecific proteolytic fragment. (F) As in E except that wild-type cells were resuspended in SD-N or treated with 0.8 mM H2O2. For all blots, Pgk1 levels were used as loading controls
![Figure 1. Ssn2/Med13 is degraded via vacuolar proteolysis following nitrogen starvation. (A) Model outlying how the cyclin-dependent kinase 8 module (CKM) of the mediator complex is disassembled following stresses that mediate cell death or survival pathways. Before stress Ssn8/Cnc1/cyclin C (CC), Ssn3/Cdk8, Ssn2/Med13 and Srb8/Med12 form the CKM that predominantly represses stress response genes (SRGs) [Citation21,Citation22]. Repression is relieved after oxidative stress and nitrogen depletion by CKM disassembly, mediated by different mechanisms. After oxidative stress, Ssn2/Med13 is destroyed by the UPS [Citation32,Citation33], which allows Ssn8/Cnc1 localization to the mitochondria where it triggers stress-induced mitochondrial fission and promotes cell death [Citation27]. In contrast, following nitrogen starvation, Ssn8/Cnc1 is rapidly destroyed by the UPS before its nuclear release to prevent mitochondrial fission [Citation20] whereas the fate of Ssn2/Med13 is the subject of this current manuscript. (B) Western blot analysis of extracts prepared from wild-type cells expressing endogenous Ssn2/Med13-9xMYC (RSY2211) resuspended in nitrogen starvation medium (SD-N) or treated with 200 ng/ml rapamycin for the indicated times. (C) As in B except that endogenous Ssn2/Med13 protein levels were monitored in ump1∆ (RSY1961, Ssn2/Med13-13xMYC) and pep4∆ prb1∆.1 (RSY2215) strains. (D) Degradation kinetics and half-life of Ssn2/Med13 protein levels obtained in B and C. Error bars indicate S.D., N = 3 of biologically independent experiments. (E) Wild-type (RSY10) or pep4∆ prb1∆.1 (RSY449) cells expressing Ssn2/Med13-GFP (pSW218) were starved for nitrogen for indicated times. For all cleavage assays, free GFP refers to the protease resistant GFP moiety that accumulates after the full-length fusion protein is degraded via the vacuole. GFP accumulation was monitored by western blot analysis using anti-GFP antibodies. An asterisk indicates a nonspecific proteolytic fragment. (F) As in E except that wild-type cells were resuspended in SD-N or treated with 0.8 mM H2O2. For all blots, Pgk1 levels were used as loading controls](/cms/asset/074f3161-0a58-4e48-953e-1b5467de46b9/kaup_a_1877934_f0001_oc.jpg)
Figure 2. Ssn2/Med13 translocates from the nucleus to the vacuole in nitrogen starvation. (A) Endogenous Ssn2/Med13-mNeongreen localization was monitored in pep4∆ prb1∆.1 cells (RSY2305) expressing Nab2-mCherry (a nuclear marker) before (growing in SD) and after 4 h in SD-N. Representative single plane images are shown. (B) As in A, except that cells expressed a vacuolar marker (Vph1-mCherry). (C) As in B, except that slices were taken through the whole cell which were then collapsed and deconvolved. Representative deconvolved images are shown. Scale bar: 5 µm. (D) Fluorescence microscopy of Ssn2/Med13-mNeonGreen for the timepoints indicated
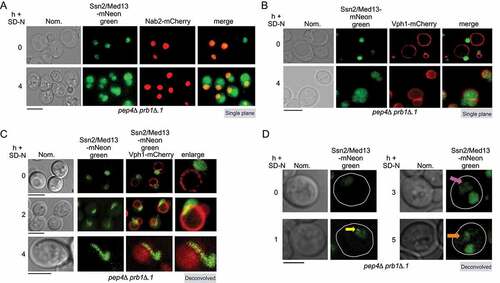
Figure 3. Ssn2/Med13 requires the core autophagy machinery for vacuolar degradation. (A) Schematic depicting the five stages of autophagy and the major autophagy protein complexes associated with each stage. (B) Western blot analysis of extracts prepared from wild-type (RSY2211), atg1∆ (RSY2214), and atg8∆ (RSY2231) cells expressing endogenous Ssn2/Med13-9xMYC resuspended in SD-N media for the indicated times. (C) Degradation kinetics and half-life of Ssn2/Med13 protein levels obtained in B. Error bars indicate S.D., N = 3 of biologically independent experiments. (D) The indicated mutants expressing Ssn2/Med13-GFP (pSW218) were starved for nitrogen for the indicated times and accumulation of free GFP monitored by western blot analysis using anti-GFP antibodies. For all experiments, Pgk1 protein levels were used as a loading control. (E and F) Endogenous Ssn2/Med13-mNeongreen localization was monitored in atg8∆ cells (RSY2307) following SD-N. Vacuoles were visualized with either CMAC (E) or using a vacuolar marker, Vph1-mCherry (F). Representative deconvolved or single-plane images are shown. Scale bar: 5 µm
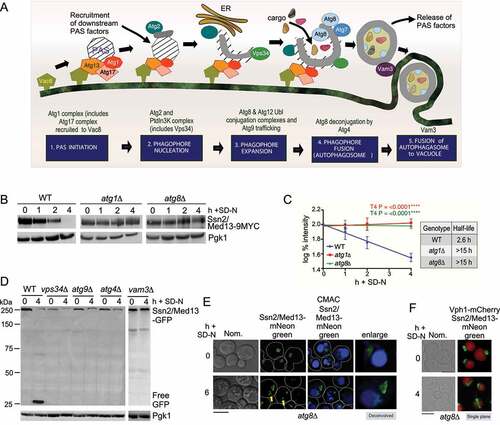
Figure 4. Ssn2/Med13 colocalizes with autophagic machinery following nitrogen starvation. (A) Localization of endogenous Ssn2/Med13-mNeongreen and Atg2-mCherry were monitored in atg8∆ cells (RSY2547) following 24 h of SD-N. (B) Same as in A except endogenous Atg7-mCherry colocalization with Ssn2/Med13-mNeongreen is monitored in atg8∆ cells (RSY2545). A 3D image is shown in the (bottom panel). (C) To visualize Ssn2/Med13 within autophagosomes, Ssn2/Med13-mNeongreen Atg8-mCherry (CUP-mCherry-Atg8) colocalization was monitored in vam3∆ cells (RSY2535). Representative deconvolved or single-plane images are shown. Scale bar: 5 µm
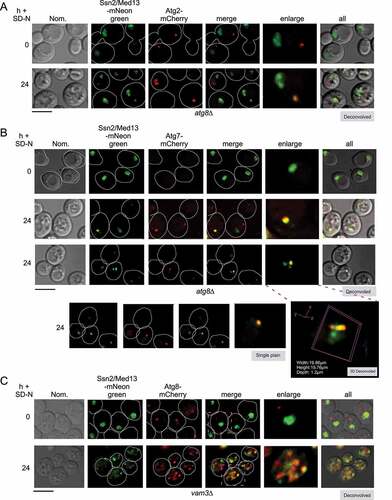
Figure 5. The autophagic degradation of Ssn2/Med13 requires the nucleoporin Gle1 and is independent of known nucleophagy pathways. (A) Western blot analysis of Ssn2/Med13-GFP cleavage assays after 4 h nitrogen depletion in micro-nucleophagy (nvj1∆, RSY2106) and macro-nucleophagy (atg39∆ atg40∆, RSY2123) mutants. (B) Same as A except Ssn2/Med13-GFP cleavage assays were performed in atg11∆ (RSY2248), atg17∆ (RSY2104), and vac8∆ cells (RSY2097). (C) Co-immunoprecipitation analysis of endogenous Gle1-GFP and Ssn2/Med13-3 HA. Whole cell lysates were immunoprecipitated with the antibodies shown from nitrogen-starved pep4∆ prb1∆.1 cells expressing endogenous Gle1-GFP (RSY2423) and Ssn2/Med13-3 HA (pKC801, lanes 1 and 4) or a vector control (lane 2). pep4∆ prb1∆.1 cells expressing Ssn2/Med13-3 HA alone (lane 3) was included as a control. [] represents no antibody control. For input controls Ssn2/Med13 was immunoprecipitated from whole cell lysates with the indicated antibodies for the three conditions tested is shown. Western blot analysis of Gle1-GFP proteins in the whole cell lysates for the three conditions tested is shown (input – bottom panel). (D) Map of Ssn2/Med13 depicting different structural regions and known interacting proteins (upper panel). Different colors represent different regions of the protein and structural regions are denoted by amino acid positions. Ssn2/Med13-Gle1 Y2H analysis. Y2H Gold cells (RSY2000) harboring Gal4-BD-Gle1 and the indicated Gal4-AD-Ssn2/Med13 subclone or empty vector control were streaked on medium selecting for plasmid maintenance (left) or induction of the ADE2 and HIS3 reporter genes (right) by Y2H interaction (lower panel). See fig. S5A, B for western blot analysis of the different constructs. (E) Fluorescence microscopy of endogenous Ssn2/Med13-mNeongreen and Gle1-RedStar (RSY2450) starved for nitrogen for 2 h in pep4∆ prb1∆.1. The yellow arrow is pointing to Ssn2/Med13 in the vacuole whereas the blue arrow shows colocalization. OE represents an over-exposed image to better show the colocalization of Gle1 and Ssn2/Med13 (pink arrows) Scale: 5 μm. (F) Fluorescence microscopy of Ssn2/Med13-mNeongreen localization in the Gle1 auxin-inducible degron (Gle1-AID) strain (RSY2473) expressing Nab2-mCherry before and after SD-N. An 8 h time point was used as the strain background is BY4741 which is not as sensitive to environmental stress as W303a. Scale: 5 µm. (G) Ssn2/Med13-GFP cleavage assays in the auxin-inducible deletion strains indicated. Cells expressing Ssn2/Med13-GFP (pSW320) were treated with 250 μM auxin for 30 m before proceeding with autophagic cleavage assays in SD-N (left panel). The GLE1 cis alleles were expressed in the GLE1::AID strain (RSY2456) harboring either pSW3345, or pSW2571 (IP6 and Dbp5 cis alleles respectively). For all blots, Pgk1 levels were used as loading controls
![Figure 5. The autophagic degradation of Ssn2/Med13 requires the nucleoporin Gle1 and is independent of known nucleophagy pathways. (A) Western blot analysis of Ssn2/Med13-GFP cleavage assays after 4 h nitrogen depletion in micro-nucleophagy (nvj1∆, RSY2106) and macro-nucleophagy (atg39∆ atg40∆, RSY2123) mutants. (B) Same as A except Ssn2/Med13-GFP cleavage assays were performed in atg11∆ (RSY2248), atg17∆ (RSY2104), and vac8∆ cells (RSY2097). (C) Co-immunoprecipitation analysis of endogenous Gle1-GFP and Ssn2/Med13-3 HA. Whole cell lysates were immunoprecipitated with the antibodies shown from nitrogen-starved pep4∆ prb1∆.1 cells expressing endogenous Gle1-GFP (RSY2423) and Ssn2/Med13-3 HA (pKC801, lanes 1 and 4) or a vector control (lane 2). pep4∆ prb1∆.1 cells expressing Ssn2/Med13-3 HA alone (lane 3) was included as a control. [] represents no antibody control. For input controls Ssn2/Med13 was immunoprecipitated from whole cell lysates with the indicated antibodies for the three conditions tested is shown. Western blot analysis of Gle1-GFP proteins in the whole cell lysates for the three conditions tested is shown (input – bottom panel). (D) Map of Ssn2/Med13 depicting different structural regions and known interacting proteins (upper panel). Different colors represent different regions of the protein and structural regions are denoted by amino acid positions. Ssn2/Med13-Gle1 Y2H analysis. Y2H Gold cells (RSY2000) harboring Gal4-BD-Gle1 and the indicated Gal4-AD-Ssn2/Med13 subclone or empty vector control were streaked on medium selecting for plasmid maintenance (left) or induction of the ADE2 and HIS3 reporter genes (right) by Y2H interaction (lower panel). See fig. S5A, B for western blot analysis of the different constructs. (E) Fluorescence microscopy of endogenous Ssn2/Med13-mNeongreen and Gle1-RedStar (RSY2450) starved for nitrogen for 2 h in pep4∆ prb1∆.1. The yellow arrow is pointing to Ssn2/Med13 in the vacuole whereas the blue arrow shows colocalization. OE represents an over-exposed image to better show the colocalization of Gle1 and Ssn2/Med13 (pink arrows) Scale: 5 μm. (F) Fluorescence microscopy of Ssn2/Med13-mNeongreen localization in the Gle1 auxin-inducible degron (Gle1-AID) strain (RSY2473) expressing Nab2-mCherry before and after SD-N. An 8 h time point was used as the strain background is BY4741 which is not as sensitive to environmental stress as W303a. Scale: 5 µm. (G) Ssn2/Med13-GFP cleavage assays in the auxin-inducible deletion strains indicated. Cells expressing Ssn2/Med13-GFP (pSW320) were treated with 250 μM auxin for 30 m before proceeding with autophagic cleavage assays in SD-N (left panel). The GLE1 cis alleles were expressed in the GLE1::AID strain (RSY2456) harboring either pSW3345, or pSW2571 (IP6 and Dbp5 cis alleles respectively). For all blots, Pgk1 levels were used as loading controls](/cms/asset/b886c2ce-3d9a-4d73-9ee6-220ca22dd39e/kaup_a_1877934_f0005_oc.jpg)
Figure 6. The sorting nexin heterodimer, Snx4-Atg20 is required for efficient autophagic degradation of Ssn2/Med13. (A) Western blot analysis of Ssn2/Med13-GFP cleavage assays after 4 h nitrogen starvation in wild-type and snx4∆ (RSY2272). (B) Co-immunoprecipitation analysis of GFP-Snx4 and Ssn2/Med13-3 HA. Whole cell lysates were immunoprecipitated with the antibodies shown from nitrogen-starved pep4∆ prb1∆.1 cells expressing GFP-Snx4 (RSY2299) and Ssn2/Med13-3 HA (pKC801, lanes 1 and 2) or a vector control (lane 4). Pep4∆ prb1∆.1 cells expressing Ssn2/Med13-3 HA alone (lane 3) was included as a control. [] represents no antibody control. For input controls Ssn2/Med13 or Snx4 was immunoprecipitated from whole cell lysates with the indicated antibodies for the three conditions tested is shown (input – bottom panel). (C) Western blot analysis of extracts prepared from wild-type (RSY2211), snx4∆ (RSY2276), atg20∆ (RSY2277), and snx41∆ (RSY2394) expressing endogenous Ssn2/Med13-9MYC resuspended in SD-N for the indicated times. (D) Degradation kinetics and half-lives of Ssn2/Med13 protein levels obtained in C. Error bars indicate S.D., N = 3 of biologically independent experiments. (E) Fluorescence microscopy of endogenous Ssn2/Med13-mNeongreen localization in snx4∆ pep4∆ prb1∆.1 (RSY2324) expressing the vacuole marker Vph1-mCherry. Cells were visualized before (SD) and after 2 h of SD-N treatment and representative single plane images are shown. Scale: 5 µm. (F) As in E except that endogenous Ssn2/Med13-mNeongreen localization was followed in nitrogen-starved pep4∆ prb1∆.1 cells. Representative single plane images of the results are shown. Bar: 5 µm. (G) Quantification of Ssn2/Med13-mNeongreen accumulation in vacuoles obtained from results in D and E. 100 cells counted per sample. N = 3 biological samples. **** P = >0.0001. For all blots, Pgk1 levels were used as loading controls
![Figure 6. The sorting nexin heterodimer, Snx4-Atg20 is required for efficient autophagic degradation of Ssn2/Med13. (A) Western blot analysis of Ssn2/Med13-GFP cleavage assays after 4 h nitrogen starvation in wild-type and snx4∆ (RSY2272). (B) Co-immunoprecipitation analysis of GFP-Snx4 and Ssn2/Med13-3 HA. Whole cell lysates were immunoprecipitated with the antibodies shown from nitrogen-starved pep4∆ prb1∆.1 cells expressing GFP-Snx4 (RSY2299) and Ssn2/Med13-3 HA (pKC801, lanes 1 and 2) or a vector control (lane 4). Pep4∆ prb1∆.1 cells expressing Ssn2/Med13-3 HA alone (lane 3) was included as a control. [] represents no antibody control. For input controls Ssn2/Med13 or Snx4 was immunoprecipitated from whole cell lysates with the indicated antibodies for the three conditions tested is shown (input – bottom panel). (C) Western blot analysis of extracts prepared from wild-type (RSY2211), snx4∆ (RSY2276), atg20∆ (RSY2277), and snx41∆ (RSY2394) expressing endogenous Ssn2/Med13-9MYC resuspended in SD-N for the indicated times. (D) Degradation kinetics and half-lives of Ssn2/Med13 protein levels obtained in C. Error bars indicate S.D., N = 3 of biologically independent experiments. (E) Fluorescence microscopy of endogenous Ssn2/Med13-mNeongreen localization in snx4∆ pep4∆ prb1∆.1 (RSY2324) expressing the vacuole marker Vph1-mCherry. Cells were visualized before (SD) and after 2 h of SD-N treatment and representative single plane images are shown. Scale: 5 µm. (F) As in E except that endogenous Ssn2/Med13-mNeongreen localization was followed in nitrogen-starved pep4∆ prb1∆.1 cells. Representative single plane images of the results are shown. Bar: 5 µm. (G) Quantification of Ssn2/Med13-mNeongreen accumulation in vacuoles obtained from results in D and E. 100 cells counted per sample. N = 3 biological samples. **** P = >0.0001. For all blots, Pgk1 levels were used as loading controls](/cms/asset/4ef4ea61-3c91-4f49-a6a9-8bb99487c956/kaup_a_1877934_f0006_oc.jpg)
Figure 7. Snx4 localizes to the nuclear periphery to retrieve Ssn2/Med13. (A) Co-immunoprecipitation analysis of endogenous Atg17-GFP and Ssn2/Med13-3 HA in the presence and absence of Snx4. Whole cell lysates were immunoprecipitated with the antibodies shown from nitrogen-starved pep4∆ prb1∆.1 (RSY2395) or snx4∆ pep4∆ prb1∆.1 cells (RSY2396) expressing endogenous Atg17-GFP and Ssn2/Med13-3 HA (pKC801, lanes 1, 2, and 6) or a vector control (lanes 4 & 5). Pep4∆ prb1∆.1 cells expressing Ssn2/Med13-3 HA alone (lane 3) was included as a control. [] represents no antibody control. For input controls Ssn2/Med13 and Atg17 were immunoprecipitated from whole cell lysates with the indicated antibodies for the three conditions tested is shown (input – bottom panel). (B) Representative images showing perinuclear and perivacuolar localization of GFP-Snx4 in wild-type expressing Nab2-mCherry (nuclear marker) before and after nitrogen starvation. Bar: 5 μm. The number of perinuclear foci was counted (N = 2) before and after nitrogen starvation. At least 100 cells were counted per sample. Data are the percentage of perinuclear foci among the total number of foci. Scale: 5 µm. (C) Fluorescence microscopy of pep4∆ prb1∆.1 cells expressing endogenous Ssn2/Med13-mNeongreen and mCherry-Snx4 (RSY2424) before and after nitrogen depletion. Hoechst staining was used to visualize the nucleus. Representative deconvolved images are shown. Bar: 5 μm. (D) GFP-Snx4 and endogenous Gle1-RedStar colocalize in wild-type cells (RSY2451) following nitrogen starvation. Representative images are shown. Bar: 5 μm
![Figure 7. Snx4 localizes to the nuclear periphery to retrieve Ssn2/Med13. (A) Co-immunoprecipitation analysis of endogenous Atg17-GFP and Ssn2/Med13-3 HA in the presence and absence of Snx4. Whole cell lysates were immunoprecipitated with the antibodies shown from nitrogen-starved pep4∆ prb1∆.1 (RSY2395) or snx4∆ pep4∆ prb1∆.1 cells (RSY2396) expressing endogenous Atg17-GFP and Ssn2/Med13-3 HA (pKC801, lanes 1, 2, and 6) or a vector control (lanes 4 & 5). Pep4∆ prb1∆.1 cells expressing Ssn2/Med13-3 HA alone (lane 3) was included as a control. [] represents no antibody control. For input controls Ssn2/Med13 and Atg17 were immunoprecipitated from whole cell lysates with the indicated antibodies for the three conditions tested is shown (input – bottom panel). (B) Representative images showing perinuclear and perivacuolar localization of GFP-Snx4 in wild-type expressing Nab2-mCherry (nuclear marker) before and after nitrogen starvation. Bar: 5 μm. The number of perinuclear foci was counted (N = 2) before and after nitrogen starvation. At least 100 cells were counted per sample. Data are the percentage of perinuclear foci among the total number of foci. Scale: 5 µm. (C) Fluorescence microscopy of pep4∆ prb1∆.1 cells expressing endogenous Ssn2/Med13-mNeongreen and mCherry-Snx4 (RSY2424) before and after nitrogen depletion. Hoechst staining was used to visualize the nucleus. Representative deconvolved images are shown. Bar: 5 μm. (D) GFP-Snx4 and endogenous Gle1-RedStar colocalize in wild-type cells (RSY2451) following nitrogen starvation. Representative images are shown. Bar: 5 μm](/cms/asset/5df5f8ba-a50d-41b2-a165-883c0d9a7fb2/kaup_a_1877934_f0007_oc.jpg)
Figure 8. The BAR domain of Snx4 interacts with the C-terminal region of Ssn2/Med13. (A) Fluorescence microscopy of Crn1-Ssn2/Med13-GFP (pSW288) in wild-type cells growing in SD. Hoechst staining was used to visualize the nucleus. Bar: 5 μm. (B) Western blot analysis of Ssn2/Med13-GFP (pSW218) or Crn1-Ssn2/Med13-GFP (pSW288) cleavage assays performed in wild-type or snx4∆ cells following nitrogen starvation. (C) Western blot analysis of endogenous Snx4-6 HA (pSH30) degradation assays performed in wild-type cells following nitrogen starvation. (D) Western blot analysis of endogenous Gle1-FLAG (RSY2456) degradation assays following nitrogen starvation. (E) Western blot analysis of Ssn2/Med13-GFP (pSW218) cleavage assays performed in wild-type cells. (F) Y2H Gold cells harboring Gal4-BD-Snx4 and the indicated Gal4-AD-Ssn2/Med13 construct or vector control were plated on medium selecting for plasmid maintenance (-LEU, -TRP) (left) or interaction by induction of the ADE2 and HIS3 reporter genes (right). See Figure S5 for western blot analysis of the different constructs. (G) Predicted structural analysis of the Ssn2/Med13 tail region using Phyre2 plot analysis of this region [Citation81]. Y2H analysis of full-length Gal4-BD-Snx4 (pSH8) and Gal4-AD-Ssn2/Med13 subclones containing either the first (pSH18) or second (pSH19) domain region of the Ssn2/Med13 tail. Cells were streaked on medium selecting for plasmid maintenance (left) or induction of reporter genes (right) by Y2H interaction. (H) Map of Snx4 depicting known domains (left panel). Y2H analysis of Snx4 PX (pSH16) and BAR binding domain constructs (pSH17) with the Ssn2/Med13907−1163AD construct and empty vector. (I) Cells were streaked on medium selecting for plasmid maintenance (left) or induction of reporter genes (right) by Y2H interaction (right panel). (J) Same as in F expect Y2H Gold cells harboring Gal4-BD-Atg20 (pSH13) and the indicated Gal4-AD-Ssn2/Med13 construct or vector control were plated on medium selecting for plasmid maintenance (-LEU, -TRP) (left) or interaction by induction of the ADE2 and HIS3 reporter genes (right). (K) Map of Ssn2/Med13 structure depicting interactive regions between indicated proteins. For all blots, Pgk1 levels were used as loading controls
![Figure 8. The BAR domain of Snx4 interacts with the C-terminal region of Ssn2/Med13. (A) Fluorescence microscopy of Crn1-Ssn2/Med13-GFP (pSW288) in wild-type cells growing in SD. Hoechst staining was used to visualize the nucleus. Bar: 5 μm. (B) Western blot analysis of Ssn2/Med13-GFP (pSW218) or Crn1-Ssn2/Med13-GFP (pSW288) cleavage assays performed in wild-type or snx4∆ cells following nitrogen starvation. (C) Western blot analysis of endogenous Snx4-6 HA (pSH30) degradation assays performed in wild-type cells following nitrogen starvation. (D) Western blot analysis of endogenous Gle1-FLAG (RSY2456) degradation assays following nitrogen starvation. (E) Western blot analysis of Ssn2/Med13-GFP (pSW218) cleavage assays performed in wild-type cells. (F) Y2H Gold cells harboring Gal4-BD-Snx4 and the indicated Gal4-AD-Ssn2/Med13 construct or vector control were plated on medium selecting for plasmid maintenance (-LEU, -TRP) (left) or interaction by induction of the ADE2 and HIS3 reporter genes (right). See Figure S5 for western blot analysis of the different constructs. (G) Predicted structural analysis of the Ssn2/Med13 tail region using Phyre2 plot analysis of this region [Citation81]. Y2H analysis of full-length Gal4-BD-Snx4 (pSH8) and Gal4-AD-Ssn2/Med13 subclones containing either the first (pSH18) or second (pSH19) domain region of the Ssn2/Med13 tail. Cells were streaked on medium selecting for plasmid maintenance (left) or induction of reporter genes (right) by Y2H interaction. (H) Map of Snx4 depicting known domains (left panel). Y2H analysis of Snx4 PX (pSH16) and BAR binding domain constructs (pSH17) with the Ssn2/Med13907−1163AD construct and empty vector. (I) Cells were streaked on medium selecting for plasmid maintenance (left) or induction of reporter genes (right) by Y2H interaction (right panel). (J) Same as in F expect Y2H Gold cells harboring Gal4-BD-Atg20 (pSH13) and the indicated Gal4-AD-Ssn2/Med13 construct or vector control were plated on medium selecting for plasmid maintenance (-LEU, -TRP) (left) or interaction by induction of the ADE2 and HIS3 reporter genes (right). (K) Map of Ssn2/Med13 structure depicting interactive regions between indicated proteins. For all blots, Pgk1 levels were used as loading controls](/cms/asset/27f5bbe9-c52b-4a6e-ab16-2303aa1471ce/kaup_a_1877934_f0008_oc.jpg)
Figure 9. Transcriptional regulators controlling ATG genes are autophagy substrates. (A) RT-qPCR analysis probing for ATG8, ATG1, and ATG14 mRNA expression in wild-type and ssn2/med13∆(RSY2444) cells in unstressed conditions. ∆∆Ct results for relative fold change (log2) values using wild-type unstressed cells as a control. Transcript levels are given relative to the internal ACT1 mRNA control. (B) Western blot analysis of Rim15-GFP (pFD846) cleavage assays in indicated mutants after nitrogen starvation. The asterisk denotes a background band. (C) Western blot analysis of Ccl1-GFP (pSW230) and Msn2-GFP (pSW217) cleavage assays in wild-type or snx4∆ cells. For all blots, Pgk1 levels were used as loading controls. (D) Summary model of the Snx4-assisted autophagy pathway. In unstressed cells, the CKM represses a subset of ATG genes. Following nitrogen starvation, an unknown signal triggers CKM disassembly releasing Ssn2/Med13. Chromatin-free Ssn2/Med13 is transported by unknown mechanisms through the NPC to the cytoplasmic nucleoporin Gle1. Gle1 releases Ssn2/Med13 to the Snx4-Atg20 heterodimer which transports it to Atg17-initiated phagophores, anchored to the vacuole. These sequester Ssn2/Med13 and the autophagosomes fuse with the vacuole for proteolysis
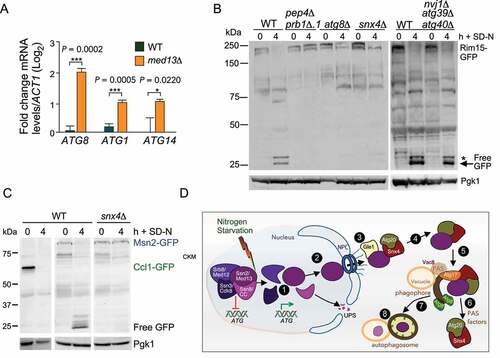
Table 1. Proteins tested in this report and their requirement for Snx4-assisted autophagy of Med13