Figures & data
Figure 1. The whole procedure of the study. (A) The experimental procedure of sample preparation. WT and atg9∆ yeast cells were cultured in SD-N medium for 0, 1 and 4 h. Then, the cells were collected for the transcriptomic and proteomic quantifications. (B) The processing and analyses of multi-omics data. For the transcriptomic data, Bowtie [Citation30], TopHat [Citation31] and Cufflinks [Citation32] were adopted for mRNA alignment, assembly and quantification. Meanwhile, MaxQuant [Citation33] and PANDA-view [Citation34] were used for processing and analyzing the proteomic data. (C) The iFIP algorithm. To integrate the transcriptomic, proteomic and interactomic data, a computational method named iFIP was developed to predict potential Atg proteins or autophagy regulators from Atg9-interacting proteins. (D) The experimental validations. Based on the results from iFIP, additional experiments were conducted to validate the predictions for finding new players in autophagy
![Figure 1. The whole procedure of the study. (A) The experimental procedure of sample preparation. WT and atg9∆ yeast cells were cultured in SD-N medium for 0, 1 and 4 h. Then, the cells were collected for the transcriptomic and proteomic quantifications. (B) The processing and analyses of multi-omics data. For the transcriptomic data, Bowtie [Citation30], TopHat [Citation31] and Cufflinks [Citation32] were adopted for mRNA alignment, assembly and quantification. Meanwhile, MaxQuant [Citation33] and PANDA-view [Citation34] were used for processing and analyzing the proteomic data. (C) The iFIP algorithm. To integrate the transcriptomic, proteomic and interactomic data, a computational method named iFIP was developed to predict potential Atg proteins or autophagy regulators from Atg9-interacting proteins. (D) The experimental validations. Based on the results from iFIP, additional experiments were conducted to validate the predictions for finding new players in autophagy](/cms/asset/70093665-83be-4aac-8c3c-3a0da8ff431c/kaup_a_1898749_f0001_oc.jpg)
Figure 2. A summary of the transcriptomic and proteomic data. (A) The numbers of clean reads sequenced from WT and atg9∆ strains. (B) The distribution of FPKM values for identified mRNAs. (C) The numbers of mRNAs detected with at least one read in WT and atg9∆ samples. (D) The overlap of significantly upregulated or downregulated mRNAs in the 3 time points. (E) The distribution of numbers of peptides in mappable proteins. (F) The distribution of intensity values of proteins in each sample before and after normalization. (G) The overlap of significantly upregulated or downregulated proteins in the 3 time points. (H) The overlap of DEMs and DEPs. (I) The GO-based enrichment analysis of biological processes at mRNA and protein levels
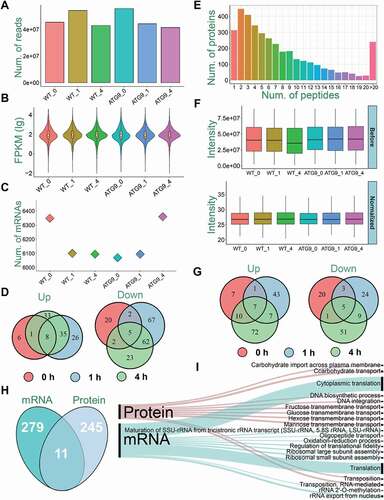
Figure 3. The analysis of the yeast Atg9 interactome during autophagy. (A) The GO-based enrichment analysis of 341 Atg9-interacting proteins, by using GO biological process terms. (B) The number of Atg9-interacting proteins detected by the transcriptomic and/or proteomic analyses. (C) The mRNA expression levels of 341 Atg9-interacting proteins. For proteins not detected by the transcriptomic profiling in any samples, their mRNA levels were set as 0 and visualized in black. (D) The protein expression levels of the Atg9 interactome. For proteins not detected, their expression levels were set as 0 and visualized in black. (E) The Spearman’s correlation between steady-state mRNA and protein abundance for the Atg9-interacting proteins. *p-value < 10−5; **p-value < 10−10; ***p-value < 10−20. (F) The overlap of DEMs in the Atg9 interactome and the 39 known Atg proteins and autophagy regulators taken from the THANATOS database [Citation8]. (G) The overlap of DEPs in the Atg9 interactome and the 39 proteins in THANATOS [Citation8]
![Figure 3. The analysis of the yeast Atg9 interactome during autophagy. (A) The GO-based enrichment analysis of 341 Atg9-interacting proteins, by using GO biological process terms. (B) The number of Atg9-interacting proteins detected by the transcriptomic and/or proteomic analyses. (C) The mRNA expression levels of 341 Atg9-interacting proteins. For proteins not detected by the transcriptomic profiling in any samples, their mRNA levels were set as 0 and visualized in black. (D) The protein expression levels of the Atg9 interactome. For proteins not detected, their expression levels were set as 0 and visualized in black. (E) The Spearman’s correlation between steady-state mRNA and protein abundance for the Atg9-interacting proteins. *p-value < 10−5; **p-value < 10−10; ***p-value < 10−20. (F) The overlap of DEMs in the Atg9 interactome and the 39 known Atg proteins and autophagy regulators taken from the THANATOS database [Citation8]. (G) The overlap of DEPs in the Atg9 interactome and the 39 proteins in THANATOS [Citation8]](/cms/asset/b386ad49-d4f7-4d11-a30e-75d78e7506ae/kaup_a_1898749_f0003_oc.jpg)
Figure 4. The overview of iFIP algorithm. The experimentally identified PPIs in S. cerevisiae were downloaded from 4 public databases, including BioGRID [Citation37], IID [Citation38], HINT [Citation39] and iRefIndex [Citation40]. The 341 Atg9-interacting proteins were mapped to 174 Atg proteins and autophagy regulators from THANATOS database. After that, 39 known Atg proteins and autophagy regulators (Red circles) were regarded as the positive data, while the remaining 302 proteins (Blue circles) were taken as the negative data. Based on 3 types of features derived from the transcriptomic, proteomic and interactomic data, the LR classifier was adopted to train an initial model, which was further refined by the GSEA method [Citation46]
![Figure 4. The overview of iFIP algorithm. The experimentally identified PPIs in S. cerevisiae were downloaded from 4 public databases, including BioGRID [Citation37], IID [Citation38], HINT [Citation39] and iRefIndex [Citation40]. The 341 Atg9-interacting proteins were mapped to 174 Atg proteins and autophagy regulators from THANATOS database. After that, 39 known Atg proteins and autophagy regulators (Red circles) were regarded as the positive data, while the remaining 302 proteins (Blue circles) were taken as the negative data. Based on 3 types of features derived from the transcriptomic, proteomic and interactomic data, the LR classifier was adopted to train an initial model, which was further refined by the GSEA method [Citation46]](/cms/asset/6ba39013-9fa5-4f04-bbdb-2129b9bb25ac/kaup_a_1898749_f0004_oc.jpg)
Figure 5. The prediction of potential Atg proteins and autophagy regulators from Atg9-interacting proteins. (A) The ROC curves with corresponding AUC values of initial and final models determined by LR and GSEA, respectively. (B) The 42 predicted Atg9-interacting proteins, including 15 known Atg proteins and autophagy regulators marked in red. For each protein, the values of different features were illustrated, and more details were shown in Table S5. (C) The functional screen of 17 genes with their corresponding KO mutants through the GFP immunoblotting assay. For each KO strain, the ratio between free GFP and the total amount of free GFP and GFP-Atg8 was measured and compared with the WT strain. (D) The FPKM and normalized intensity values of mRNA and protein expressions were shown for GLO3 and SCS7 in different samples if quantified, respectively. All experiments were independently repeated 3 times. Statistical analyses were conducted by using the two-sided t-test.*p-value < 0.05; **p-value < 0.01; ****p-value < 0.0001
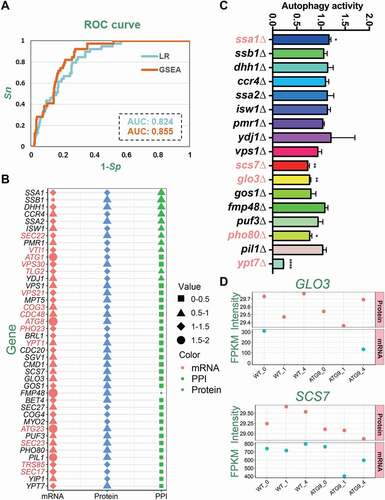
Figure 6. The mRNA and protein expressions of Glo3 and Scs7 were affected by Atg9 during autophagy. (A and B) The mRNA expressions of GLO3 and SCS7 in WT and atg9∆ cells, which were cultured in SD-N medium for 0, 1, 2, 3, and 4 h. (C and D) The WT and atg9∆ cells expressing Glo3-GFP were cultured under nitrogen starvation for 0, 1, 2, 3, and 4 h. The cell lysates were immunoblotted with anti-GFP antibodies, and the relative expressions of Glo3 were calculated by the ratios between Glo3-GFP and Pgk1. (E and F) The expressions of Scs7-GFP protein were detected and measured in WT and atg9∆ cells under nitrogen deprivation for 0, 1, 2, 3, and 4 h. (G and H) The mRNA expressions of GLO3 and SCS7 were detected in WT and Atg9-OE cells during autophagy. (I and L) The protein expressions of Glo3-GFP and Scs7-GFP in WT and Atg9-OE cells at 5 time points were separately detected by immunoblotting. The relative expressions of Glo3-GFP and Scs7-GFP were quantified by the ratios of Glo3-GFP vs. Pgk1 and Scs7-GFP vs. Pgk1, respectively. All experiments were independently repeated 3 times. The two-sided t-test was used for statistical analyses.*p-value < 0.05; **p-value < 0.01; ***p-value < 0.001; ****p-value < 0.0001
Figure 7. Glo3 and Scs7 interact and colocalize with Atg9. (A) The yeast cells expressed FLAG-tagged Atg9 and GST-HA-tagged Glo3 were collected and lysed. Then, the cell lysates were immunoprecipitated with anti-FLAG, and immunoprecipitates were analyzed with immunoblotting with the anti-FLAG and anti-HA antibodies. (B) The relative intensity of GST-HA-Glo3 in Co-IP was measured. (C) The Co-IP assay of FLAG-Atg9 and GST-HA-Scs7, and (D) the quantification of the relative expression of GST-HA-Scs7. (E) The WT cells expressing Glo3-tdTomato and Atg9-2× GFP were treated after nitrogen starvation for 0, 1, 2, 3, and 4 h, and then observed through confocal microscopy. Scale bar: 2 μm. (F) The proportion of cells with the colocalization between Glo3-tdTomato and Atg9-2× GFP was counted by analyzing > 300 cells. (G) The confocal observation for Scs7, and (H) the proportion of cells with Scs7-tdTomato colocalized with Atg9-2× GFP was counted by analyzing > 300 cells. Scale bar: 2 μm. DIC, differential interference contrast. All experiments were independently repeated 3 times. The two-sided t-test was used for statistical analyses.*p-value < 0.05; **p-value < 0.01; ***p-value < 0.001
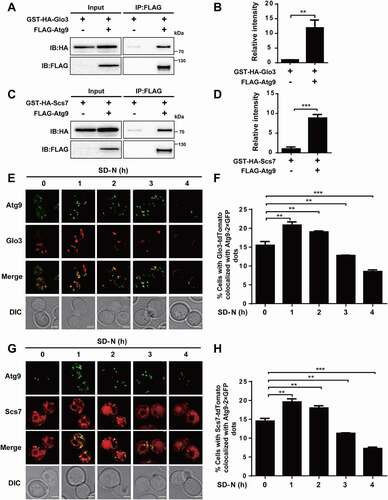
Figure 8. GLO3 and SCS7 are essential for regulation of autophagy. (A) The immunoblotting results of the GFP-Atg8 cleavage and (B) the ratios between free GFP and the total amount of free GFP and GFP-Atg8 were presented in WT and glo3∆ strains after nitrogen starvation for 1 and 2 h. (C) The phenotypic observation was conducted by the confocal microscopy for WT and glo3∆ cells expressing GFP-Atg8, which were stained by FM 4–64 dye, and then treated with SD-N medium for 0, 1 and 2 h. Scale bar: 2 μm. (D) The autophagy activities were automatically determined by DeepPhagy in WT and glo3∆ strains. (E) The ALP activity was measured in WT and glo3∆ strains, after nitrogen starvation for 0 and 4 h. For scs7∆ strains, the same procedure of (F) the immunoblotting assay, (G) the measurement of the ratios between free GFP and the total amount of free GFP and GFP-Atg8, (H) the confocal observation, (I) the DeepPhagy analysis, and (J) the ALP activity analysis. Scale bar: 2 μm. DIC, differential interference contrast. All experiments were independently repeated 3 times. Statistical analyses were conducted by using the two-sided t-test. *p-value < 0.05; **p-value < 0.01
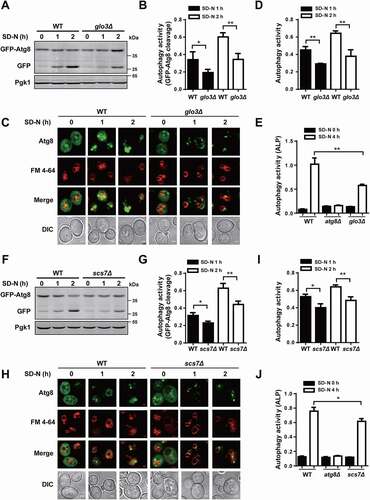
Figure 9. The influence of GLO3 and SCS7 on Atg9 localization and trafficking, as well as selective autophagy. (A) The TN124 yeast cells expressing Atg9-2× GFP and 2× Katushka-Atg8 in WT and glo3∆ strains were cultured in SD-N medium for 1 h, and then observed by fluorescence microscope. Scale bar: 2 μm. (B) > 300 cells were counted to calculate the proportion of cells with Atg9-2× GFP dots colocalized with 2× Katushka-Atg8 dots. (C) Images of WT and scs7∆ cells expressing Atg9-2× GFP and 2× Katushka-Atg8, which were cultured under nitrogen starvation for 1 h. Scale bar: 2 μm. (D) > 300 cells were analyzed for the colocalization of Atg9-2× GFP dots and 2× Katushka-Atg8 dots. (E) The WT and glo3∆ cells expressing Atg9-2× GFP and Atg1-tdTomato were treated in SD-N medium for 1 h. Scale bar: 2 μm. (F) > 300 cells were counted to calculate the proportion of cells with Atg9-2× GFP dots colocalized with Atg1-tdTomato dots. (G) The cells expressing Atg9-2× GFP in WT, glo3∆, atg1∆, or atg1∆ glo3∆ strains were treated after nitrogen starvation for 1 h, and then observed through fluorescence microscope. Scale bar: 2 μm. (H) The proportion of cells with a single GFP dot was counted by analyzing > 300 cells for each strain. (I) The cells expressing GFP-Atg19 in WT and glo3∆ strains were cultured in SD-N medium for 0, 1, 2 h. The cell lysates were immunoblotted and analyzed by anti-GFP and anti-Pgk1 antibodies. (J) The analyses of GFP-Atg19 cleavage were conducted and quantified by the ratios between free GFP and the total amount of free GFP and GFP-Atg19. (K) The immunoblotting results of the GFP-Atg19 cleavage and (L) the ratios between free GFP and the total amount of free GFP and GFP-Atg19 were shown in WT and scs7∆ strains under nitrogen starvation treatment for 1 and 2 h. DIC, differential interference contrast. All experiments were independently repeated 3 times. The two-sided t-test was used for statistical analyses.*p-value < 0.05; **p-value < 0.01, ***p-value < 0.001
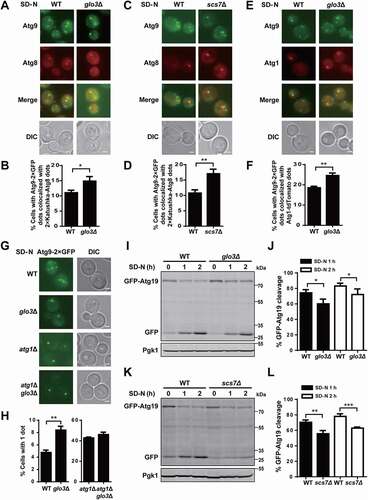
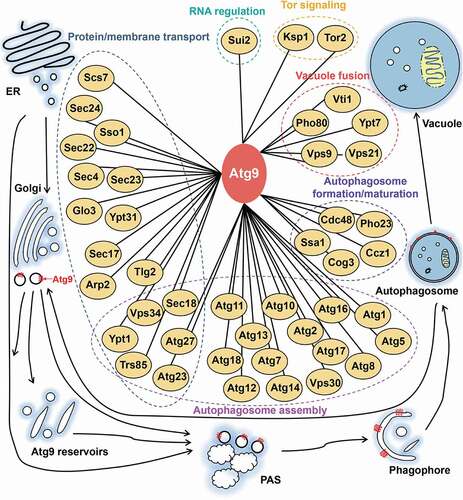
Figure 10. An integrative model of the Atg9 interactome, which contained Atg9 and its known interacting partners derived from our results and previous studies. The 44 Atg9-interacting proteins were classified into 6 groups, based on their corresponding biological functions in autophagic process