Figures & data
Figure 1. TNF treatment induces activation of AMPK. (A) L929 cells were transfected with non-targeting (siCtrl) or Ripk3 siRNAs (siRipk3). 48 h post transfection, cells were exposed to 10 ng/ml TNF and 30 µM QVD (TQ) for the indicated times. Then, whole cell lysates were subjected to SDS-PAGE and immunoblotting for indicated proteins. A compilation of representative immunoblots is shown; three ACTB immunblots are shown, but each protein was normalized to its corresponding loading control. The density of each protein band was divided by the average of the density of all bands from the same protein on the membrane. Fold changes were calculated by dividing each normalized ratio (protein to loading control) by the average of the ratios of the control lane (scr, 0 h TQ). Results are mean + SD from at least 3 independent experiments. Statistical analysis was done by repeated measures two-way ANOVA (corrected by Sidak’s multiple comparisons test between siRNAs and corrected by Tukey’s multiple comparisons test between time points). Statistically significant differences within non-targeting siRNA-transfected cells (compared to scr, 0 h TQ) are depicted as letters directly above the bars. * or a: P < 0.05, ** or b: P < 0.01, *** or c: P < 0.001, **** or d: P < 0.0001. (B) Ripk3 WT and KO MEFs were exposed to indicated treatments (medium [M], 30 ng/ml TNF [T], 100 nM SMAC-mimetic [S], 20 µM z-VAD [Z]) for indicated times. Then, cells were lysed and cleared cellular lysates were subjected to SDS-PAGE and analyzed by immunoblotting for indicated proteins
![Figure 1. TNF treatment induces activation of AMPK. (A) L929 cells were transfected with non-targeting (siCtrl) or Ripk3 siRNAs (siRipk3). 48 h post transfection, cells were exposed to 10 ng/ml TNF and 30 µM QVD (TQ) for the indicated times. Then, whole cell lysates were subjected to SDS-PAGE and immunoblotting for indicated proteins. A compilation of representative immunoblots is shown; three ACTB immunblots are shown, but each protein was normalized to its corresponding loading control. The density of each protein band was divided by the average of the density of all bands from the same protein on the membrane. Fold changes were calculated by dividing each normalized ratio (protein to loading control) by the average of the ratios of the control lane (scr, 0 h TQ). Results are mean + SD from at least 3 independent experiments. Statistical analysis was done by repeated measures two-way ANOVA (corrected by Sidak’s multiple comparisons test between siRNAs and corrected by Tukey’s multiple comparisons test between time points). Statistically significant differences within non-targeting siRNA-transfected cells (compared to scr, 0 h TQ) are depicted as letters directly above the bars. * or a: P < 0.05, ** or b: P < 0.01, *** or c: P < 0.001, **** or d: P < 0.0001. (B) Ripk3 WT and KO MEFs were exposed to indicated treatments (medium [M], 30 ng/ml TNF [T], 100 nM SMAC-mimetic [S], 20 µM z-VAD [Z]) for indicated times. Then, cells were lysed and cleared cellular lysates were subjected to SDS-PAGE and analyzed by immunoblotting for indicated proteins](/cms/asset/bf7ebf98-bd9d-43f6-b5de-5f2657d84a9d/kaup_a_1899667_f0001_c.jpg)
Figure 2. TNF treatment induces ATG14 and ATG16L1 puncta formation via RIPK3 and AMPK. (A and B) WT and ripk3 KO L929 cells were exposed to indicated treatments (medium [M], 10 ng/ml TNF [T], 30 µM QVD [Q], 5 µM GSK’872 [G]) for 3 h. After that, cells were fixed and subjected to ATG14 (A) or ATG16L1 (B) immunostaining using anti-ATG14 (Santa Cruz Biotechnology, sc-164767) or anti-ATG16L1 antibodies (MBL International, PM040) and IRDye® 680RD donkey anti-goat or Alexa Fluor®488-conjugated goat anti-rabbit IgG (H + L) secondary antibodies. Puncta quantification was done using ImageJ software. Data represent mean + SD. A minimum of 120 (A) or 261 cells (B) was analyzed. (C) WT L929 cells were transfected with non-targeting (siCtrl) or Prkaa1/Prkaa2 siRNAs (siPrkaa1/siPrkaa2). 48 h post transfection, cells were left untreated (medium, M) or exposed to 10 ng/ml TNF and 30 µM QVD (TQ) for 3 h. Then, cells were fixed and subjected to ATG16L1 immunostaining using anti-ATG16L1 antibodies (MBL International, PM040) and Alexa Fluor®488-conjugated goat anti-rabbit IgG (H + L) secondary antibodies. Puncta quantification was done using ImageJ software. Data represent mean + SD. A minimum of 655 cells was analyzed. (D) WT L929 cells were left untreated (medium, M) or exposed to indicated treatments (10 ng/ml TNF [T], 30 µM QVD [Q], 5 µM AMPK inhibitor dorsomorphin) for 3 h. Then, cells were fixed and subjected to ATG16L1 immunostaining using anti-ATG16L1 antibodies (MBL International, PM040) and Alexa Fluor®488-conjugated goat anti-rabbit IgG (H + L) secondary antibodies. Puncta quantification was done using ImageJ software. Data represent mean + SD. A minimum of 122 cells was analyzed. (A-D) Statistical analysis was performed using ordinary one-way ANOVA (corrected by Tukey’s multiple comparisons test) for A, B and D; or two-way ANOVA (corrected by Tukey’s multiple comparisons test) for C. For B, statistical analysis was additionally performed using unpaired t test with Welch’s correction (TQ treatment of WT vs. ripk3 KO cells). ****P < 0.0001. Scale bar: 20 µm
![Figure 2. TNF treatment induces ATG14 and ATG16L1 puncta formation via RIPK3 and AMPK. (A and B) WT and ripk3 KO L929 cells were exposed to indicated treatments (medium [M], 10 ng/ml TNF [T], 30 µM QVD [Q], 5 µM GSK’872 [G]) for 3 h. After that, cells were fixed and subjected to ATG14 (A) or ATG16L1 (B) immunostaining using anti-ATG14 (Santa Cruz Biotechnology, sc-164767) or anti-ATG16L1 antibodies (MBL International, PM040) and IRDye® 680RD donkey anti-goat or Alexa Fluor®488-conjugated goat anti-rabbit IgG (H + L) secondary antibodies. Puncta quantification was done using ImageJ software. Data represent mean + SD. A minimum of 120 (A) or 261 cells (B) was analyzed. (C) WT L929 cells were transfected with non-targeting (siCtrl) or Prkaa1/Prkaa2 siRNAs (siPrkaa1/siPrkaa2). 48 h post transfection, cells were left untreated (medium, M) or exposed to 10 ng/ml TNF and 30 µM QVD (TQ) for 3 h. Then, cells were fixed and subjected to ATG16L1 immunostaining using anti-ATG16L1 antibodies (MBL International, PM040) and Alexa Fluor®488-conjugated goat anti-rabbit IgG (H + L) secondary antibodies. Puncta quantification was done using ImageJ software. Data represent mean + SD. A minimum of 655 cells was analyzed. (D) WT L929 cells were left untreated (medium, M) or exposed to indicated treatments (10 ng/ml TNF [T], 30 µM QVD [Q], 5 µM AMPK inhibitor dorsomorphin) for 3 h. Then, cells were fixed and subjected to ATG16L1 immunostaining using anti-ATG16L1 antibodies (MBL International, PM040) and Alexa Fluor®488-conjugated goat anti-rabbit IgG (H + L) secondary antibodies. Puncta quantification was done using ImageJ software. Data represent mean + SD. A minimum of 122 cells was analyzed. (A-D) Statistical analysis was performed using ordinary one-way ANOVA (corrected by Tukey’s multiple comparisons test) for A, B and D; or two-way ANOVA (corrected by Tukey’s multiple comparisons test) for C. For B, statistical analysis was additionally performed using unpaired t test with Welch’s correction (TQ treatment of WT vs. ripk3 KO cells). ****P < 0.0001. Scale bar: 20 µm](/cms/asset/95adb229-e402-4309-9108-03e404971362/kaup_a_1899667_f0002_c.jpg)
Figure 3. RIPK3 interacts with AMPK. (A) S100 extracts of MEFs were separated by size-exclusion chromatography on a Superose 6 increase column. Fractions were analyzed by immunoblotting for the indicated proteins. The diagram shows protein levels for fractions 16–40 and the density of each protein band was divided by the average of the density of all bands from the same protein on the membrane. (B) HEK293 cells were left untransfected or were transfected with a vector encoding 3xFLAG-HsRIPK3 for 24 h. Then, cells were lysed and cleared cellular lysates were subjected to immunopurification using anti-FLAG beads. Purified proteins were subjected to SDS-PAGE and analyzed by immunoblotting for FLAG and AMPK. (C) HEK293 cells were left untransfected or were transfected with a vector encoding 3xFLAG-HsRIPK3 for 24 h. Then, cells were lysed and cleared cellular lysates were subjected to immunopurification using anti-AMPK antibodies. Purified proteins were subjected to SDS-PAGE and analyzed by immunoblotting for FLAG and AMPK. (D) L929 cells were lysed and cleared cellular lysates were subjected to immunopurification using anti-IgG or anti-RIPK3 antibodies. Purified proteins were subjected to SDS-PAGE and analyzed by immunoblotting for AMPK and RIPK3. (E) GST or GST-MmRIPK3 immobilized on glutathione-Sepharose beads was incubated with His-AMPK [His-HsPRKAA1 (11–559) + HsPRKAB2 (1–272) + HsPRKAG1 (1–331)] overnight. After washing the beads, bound proteins were eluted by boiling for 10 min at 95°C. Proteins were subjected to SDS-PAGE and analyzed by immunoblotting for AMPK and GST. (F) ripk3 KO MEFs were retrovirally transfected with empty vector or cDNA encoding 3xFLAG-MmRIPK3. Cells were seeded onto glass coverslips. The next day, cells were fixed and analyzed using proximity ligation assay as described in the material and methods section (anti-RIPK3: Prosci, 2283; anti-PRKAA1/2: Cell Signaling Technology, 2793). Nuclei were stained with DAPI. Signals and nuclei per image were counted and the signal:nuclei ratio was calculated. Data represent mean + SD. A minimum of 216 cells was analyzed. Statistical analysis was performed using an unpaired t test with Welch’s correction. ****P < 0.0001. Scale bar: 20 µm
![Figure 3. RIPK3 interacts with AMPK. (A) S100 extracts of MEFs were separated by size-exclusion chromatography on a Superose 6 increase column. Fractions were analyzed by immunoblotting for the indicated proteins. The diagram shows protein levels for fractions 16–40 and the density of each protein band was divided by the average of the density of all bands from the same protein on the membrane. (B) HEK293 cells were left untransfected or were transfected with a vector encoding 3xFLAG-HsRIPK3 for 24 h. Then, cells were lysed and cleared cellular lysates were subjected to immunopurification using anti-FLAG beads. Purified proteins were subjected to SDS-PAGE and analyzed by immunoblotting for FLAG and AMPK. (C) HEK293 cells were left untransfected or were transfected with a vector encoding 3xFLAG-HsRIPK3 for 24 h. Then, cells were lysed and cleared cellular lysates were subjected to immunopurification using anti-AMPK antibodies. Purified proteins were subjected to SDS-PAGE and analyzed by immunoblotting for FLAG and AMPK. (D) L929 cells were lysed and cleared cellular lysates were subjected to immunopurification using anti-IgG or anti-RIPK3 antibodies. Purified proteins were subjected to SDS-PAGE and analyzed by immunoblotting for AMPK and RIPK3. (E) GST or GST-MmRIPK3 immobilized on glutathione-Sepharose beads was incubated with His-AMPK [His-HsPRKAA1 (11–559) + HsPRKAB2 (1–272) + HsPRKAG1 (1–331)] overnight. After washing the beads, bound proteins were eluted by boiling for 10 min at 95°C. Proteins were subjected to SDS-PAGE and analyzed by immunoblotting for AMPK and GST. (F) ripk3 KO MEFs were retrovirally transfected with empty vector or cDNA encoding 3xFLAG-MmRIPK3. Cells were seeded onto glass coverslips. The next day, cells were fixed and analyzed using proximity ligation assay as described in the material and methods section (anti-RIPK3: Prosci, 2283; anti-PRKAA1/2: Cell Signaling Technology, 2793). Nuclei were stained with DAPI. Signals and nuclei per image were counted and the signal:nuclei ratio was calculated. Data represent mean + SD. A minimum of 216 cells was analyzed. Statistical analysis was performed using an unpaired t test with Welch’s correction. ****P < 0.0001. Scale bar: 20 µm](/cms/asset/464918b5-b9dc-46e5-84f8-d18f5805733d/kaup_a_1899667_f0003_c.jpg)
Figure 4. RIPK3 directly phosphorylates PRKAA1 at T183. (A) For in vitro kinase assay, purified GST, GST-HsPRKAA1(1–278) and GST-HsPRKAA1(279–559) were incubated with activated RIPK3 and [γ-32P]-ATP. The reactions were subjected to SDS-PAGE. After Coomassie Brilliant Blue staining and drying of the gels, autoradiography was performed. (B) GST-HsPRKAA1 WT and the T183A mutant were purified and were incubated with activated RIPK3 and cold ATP. The reactions were subjected to SDS-PAGE and analyzed by immunoblotting for phospho-PRKAA1/2 T183/T172 and AMPK. (C) GST-HsPRKAA1 WT and the T183A mutant were incubated with activated RIPK3 and cold ATP with or without alkaline phosphatase. The reactions were subjected to SDS-PAGE and analyzed by immunoblotting for phospho-PRKAA1/2 T183/T172 and AMPK. (D) GST-HsPRKAA1 WT was incubated with activated RIPK3 and cold ATP with or without 50 µM GSK’872. The reactions were subjected to SDS-PAGE and analyzed by immunoblotting for phospho-PRKAA1/2 T183/T172 and AMPK. (E) HEK293 cells were left untransfected or were transfected with cDNA encoding either 3xFLAG-HsRIPK3 WT or 3xFLAG-HsRIPK3 kinase-dead (KD) for 24 h. After that, cells were treated with 30 ng/ml TNF + 30 µM QVD for 24 h. Then, cells were lysed and cleared cellular lysates were subjected to SDS-PAGE and analyzed by immunoblotting for phospho-PRKAA1/2 T183/T172, AMPK, FLAG and ACTB. (F) ripk3 KO MEFs were retrovirally transfected with empty vector or cDNA encoding 3xFLAG-MmRIPK3. Cells were seeded onto glass coverslips. The next day, the cells were left untreated (medium, M) or treated with 30 ng/ml TNF + 100 nM SMAC-mimetic + 20 µM z-VAD (TSZ) for 3 h. Then cells were fixed and analyzed using proximity ligation assay as described in the material and methods section (anti-phospho-PRKAA1/2 T183/T172: Cell Signaling Technology, 2535; anti-PRKAA1/2: Cell Signaling Technology, 2793). Nuclei were stained with DAPI. Signals and nuclei per image were counted and the signal:nuclei ratio was calculated. Data represent mean + SD. A minimum of 107 cells was analyzed. Statistical analysis was performed using ordinary two-way ANOVA (corrected by Tukey’s multiple comparisons test). ****P < 0.0001. Scale bar: 20 µm. (G) L929 cells were transiently transfected with cDNA encoding either 3xFLAG-HsPRKAG1 WT or R299G for 24 h. After that, cells were treated with or without 10 ng/ml TNF + 30 µM QVD (TQ) for 2 h. Then, cells were lysed and cleared cellular lysates were subjected to immunopurification using anti-FLAG beads. Purified proteins were subjected to SDS-PAGE and analyzed by immunoblotting for indicated proteins
![Figure 4. RIPK3 directly phosphorylates PRKAA1 at T183. (A) For in vitro kinase assay, purified GST, GST-HsPRKAA1(1–278) and GST-HsPRKAA1(279–559) were incubated with activated RIPK3 and [γ-32P]-ATP. The reactions were subjected to SDS-PAGE. After Coomassie Brilliant Blue staining and drying of the gels, autoradiography was performed. (B) GST-HsPRKAA1 WT and the T183A mutant were purified and were incubated with activated RIPK3 and cold ATP. The reactions were subjected to SDS-PAGE and analyzed by immunoblotting for phospho-PRKAA1/2 T183/T172 and AMPK. (C) GST-HsPRKAA1 WT and the T183A mutant were incubated with activated RIPK3 and cold ATP with or without alkaline phosphatase. The reactions were subjected to SDS-PAGE and analyzed by immunoblotting for phospho-PRKAA1/2 T183/T172 and AMPK. (D) GST-HsPRKAA1 WT was incubated with activated RIPK3 and cold ATP with or without 50 µM GSK’872. The reactions were subjected to SDS-PAGE and analyzed by immunoblotting for phospho-PRKAA1/2 T183/T172 and AMPK. (E) HEK293 cells were left untransfected or were transfected with cDNA encoding either 3xFLAG-HsRIPK3 WT or 3xFLAG-HsRIPK3 kinase-dead (KD) for 24 h. After that, cells were treated with 30 ng/ml TNF + 30 µM QVD for 24 h. Then, cells were lysed and cleared cellular lysates were subjected to SDS-PAGE and analyzed by immunoblotting for phospho-PRKAA1/2 T183/T172, AMPK, FLAG and ACTB. (F) ripk3 KO MEFs were retrovirally transfected with empty vector or cDNA encoding 3xFLAG-MmRIPK3. Cells were seeded onto glass coverslips. The next day, the cells were left untreated (medium, M) or treated with 30 ng/ml TNF + 100 nM SMAC-mimetic + 20 µM z-VAD (TSZ) for 3 h. Then cells were fixed and analyzed using proximity ligation assay as described in the material and methods section (anti-phospho-PRKAA1/2 T183/T172: Cell Signaling Technology, 2535; anti-PRKAA1/2: Cell Signaling Technology, 2793). Nuclei were stained with DAPI. Signals and nuclei per image were counted and the signal:nuclei ratio was calculated. Data represent mean + SD. A minimum of 107 cells was analyzed. Statistical analysis was performed using ordinary two-way ANOVA (corrected by Tukey’s multiple comparisons test). ****P < 0.0001. Scale bar: 20 µm. (G) L929 cells were transiently transfected with cDNA encoding either 3xFLAG-HsPRKAG1 WT or R299G for 24 h. After that, cells were treated with or without 10 ng/ml TNF + 30 µM QVD (TQ) for 2 h. Then, cells were lysed and cleared cellular lysates were subjected to immunopurification using anti-FLAG beads. Purified proteins were subjected to SDS-PAGE and analyzed by immunoblotting for indicated proteins](/cms/asset/2f7ec1e5-64fc-4987-98f6-e5ec9a66befe/kaup_a_1899667_f0004_c.jpg)
Figure 5. Necroptosis inhibits lysosomal LC3 degradation. (A) L929 cells were left untreated (medium, M) or exposed to 30 µM QVD (Q), 20 nM bafilomycin A1 (B), 10 ng/ml TNF (T), 10 ng/ml TNF + 30 µM QVD with or without 20 nM bafilomycin A1 (TQ or TQB) for indicated times. Then, cells were lysed and cleared cellular lysates were subjected to SDS-PAGE and immunoblotting for indicated proteins. The density of each protein band was divided by the average of the density of all bands from the same protein on the membrane. Fold changes were calculated by dividing each normalized ratio (protein to loading control) by the average of the ratios of the control lane (medium). Statistical graphics represents mean + SD (n = 4). (B) L929 WT, ripk3 KO or MLKL KO cells were exposed to 10 ng/ml TNF and 30 µM QVD (TQ) for indicated times. Then, cells were lysed and cleared cellular lysates were subjected to SDS-PAGE and immunoblotting for indicated proteins. The density of each protein band was divided by the average of the density of all bands from the same protein on the membrane. Fold changes were calculated by dividing each normalized ratio (protein to loading control) by the average of the ratios of the control lane (medium). Statistical graphics represents mean + SD (n = 3). (C) L929 cells retrovirally transfected with cDNA encoding mRFP-EGFP-rLC3 were transfected with non-targeting (siCtrl) or Ripk3 siRNAs (siRipk3). 48 h post transfection, cells were left untreated (medium, M) or exposed to indicated treatments (10 ng/ml TNF [T], 30 µM QVD [Q], 20 nM bafilomycin A1 [B]) for 3 h. Then cells were fixed and RFP and GFP fluorescence was analyzed by immunofluorescence microscopy. The colocalization intensity was analyzed using Pearson’s correlation coefficient using ImageJ software. Scale bar: 20 µm. (D) L929 cells were retrovirally transfected with cDNA encoding mCitrine-LC3B. Cells were left untreated (medium, M) or treated using 10 ng/ml TNF + 30 µM QVD (TQ) or EBSS with or without 20 nM bafilomycin A1 (B) for indicated times. Cells were collected and mCitrine fluorescence intensity was measured by flow cytometry. The mean of fluorescence intensity for each sample was normalized to cells incubated in growth medium (M). Data represent mean + SD from two independent experiments. (A-D) Statistical analysis was done by repeated measures two-way ANOVA (corrected by Tukey’s multiple comparisons test) for A, B and D, and by ordinary one-way ANOVA (corrected by Tukey’s multiple comparisons test) for C. For C, statistical analysis was additionally performed using unpaired t test with Welch’s correction (TQ treatment of non-targeting vs. Ripk3 siRNA). For A and B, statistically significant differences are only indicated for 6 h; for D, statistically significant differences are only indicated for 6 h vs. 6 h + bafilomycin A1. Statistically significant differences to control (medium, M) are depicted as letters directly above the bars. * or a: P < 0.05, ** or b: P < 0.01, *** or c: P < 0.001, **** or d: P < 0.0001
![Figure 5. Necroptosis inhibits lysosomal LC3 degradation. (A) L929 cells were left untreated (medium, M) or exposed to 30 µM QVD (Q), 20 nM bafilomycin A1 (B), 10 ng/ml TNF (T), 10 ng/ml TNF + 30 µM QVD with or without 20 nM bafilomycin A1 (TQ or TQB) for indicated times. Then, cells were lysed and cleared cellular lysates were subjected to SDS-PAGE and immunoblotting for indicated proteins. The density of each protein band was divided by the average of the density of all bands from the same protein on the membrane. Fold changes were calculated by dividing each normalized ratio (protein to loading control) by the average of the ratios of the control lane (medium). Statistical graphics represents mean + SD (n = 4). (B) L929 WT, ripk3 KO or MLKL KO cells were exposed to 10 ng/ml TNF and 30 µM QVD (TQ) for indicated times. Then, cells were lysed and cleared cellular lysates were subjected to SDS-PAGE and immunoblotting for indicated proteins. The density of each protein band was divided by the average of the density of all bands from the same protein on the membrane. Fold changes were calculated by dividing each normalized ratio (protein to loading control) by the average of the ratios of the control lane (medium). Statistical graphics represents mean + SD (n = 3). (C) L929 cells retrovirally transfected with cDNA encoding mRFP-EGFP-rLC3 were transfected with non-targeting (siCtrl) or Ripk3 siRNAs (siRipk3). 48 h post transfection, cells were left untreated (medium, M) or exposed to indicated treatments (10 ng/ml TNF [T], 30 µM QVD [Q], 20 nM bafilomycin A1 [B]) for 3 h. Then cells were fixed and RFP and GFP fluorescence was analyzed by immunofluorescence microscopy. The colocalization intensity was analyzed using Pearson’s correlation coefficient using ImageJ software. Scale bar: 20 µm. (D) L929 cells were retrovirally transfected with cDNA encoding mCitrine-LC3B. Cells were left untreated (medium, M) or treated using 10 ng/ml TNF + 30 µM QVD (TQ) or EBSS with or without 20 nM bafilomycin A1 (B) for indicated times. Cells were collected and mCitrine fluorescence intensity was measured by flow cytometry. The mean of fluorescence intensity for each sample was normalized to cells incubated in growth medium (M). Data represent mean + SD from two independent experiments. (A-D) Statistical analysis was done by repeated measures two-way ANOVA (corrected by Tukey’s multiple comparisons test) for A, B and D, and by ordinary one-way ANOVA (corrected by Tukey’s multiple comparisons test) for C. For C, statistical analysis was additionally performed using unpaired t test with Welch’s correction (TQ treatment of non-targeting vs. Ripk3 siRNA). For A and B, statistically significant differences are only indicated for 6 h; for D, statistically significant differences are only indicated for 6 h vs. 6 h + bafilomycin A1. Statistically significant differences to control (medium, M) are depicted as letters directly above the bars. * or a: P < 0.05, ** or b: P < 0.01, *** or c: P < 0.001, **** or d: P < 0.0001](/cms/asset/30dead22-91d9-4516-9bc1-8307e4d4161a/kaup_a_1899667_f0005_c.jpg)
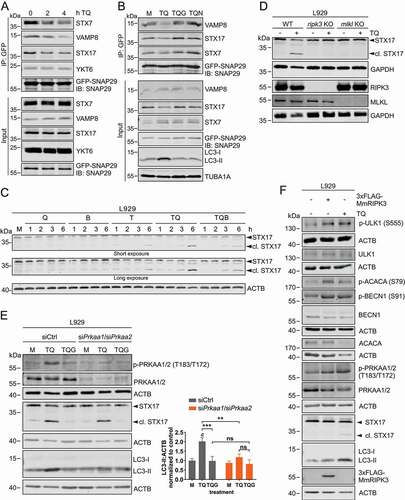
Figure 6. Necroptosis induced by TNF destabilizes SNARE complexes and cleaves STX17 to block LC3 degradation. (A) L929 cells stably expressing GFP-SNAP29 were exposed to 10 ng/ml TNF and 30 µM QVD (TQ) for indicated times. Then, cells were lysed and cleared cellular lysates were subjected to immunopurification using anti-GFP beads. Purified proteins were subjected to SDS-PAGE and analyzed by immunoblotting for indicated proteins. (B) L929 cells stably expressing GFP-SNAP29 were left untreated (medium, M) or exposed to 10 ng/ml TNF + 30 µM QVD (TQ), TQ plus 5 µM GSK’872 (TQG), or TQ plus 5 µM necrostatin-1 (TQN) for 4 h. Then, cells were lysed and cleared cellular lysates were subjected to immunopurification using anti-GFP beads. Purified proteins were subjected to SDS-PAGE and analyzed by immunoblotting for indicated proteins. (C) L929 cells were left untreated (medium, M) or exposed to 30 µM QVD (Q), 20 nM bafilomycin A1 (B), 10 ng/ml TNF (T), 10 ng/ml TNF + 30 µM QVD with or without 20 nM bafilomycin A1 (TQ or TQB) for indicated times. Then, cells were lysed and cleared cellular lysates were subjected to SDS-PAGE and immunoblotting for STX17 and ACTB. (D) L929 WT, ripk3 KO or mlkl KO cells were left untreated or exposed to 10 ng/ml TNF + 30 µM QVD (TQ) for 4 h. Then, cells were lysed and cleared cellular lysates were subjected to SDS-PAGE and immunoblotting for STX17, RIPK3, MLKL, and GAPDH. (E) L929 cells were transfected with non-targeting (siCtrl) or Prkaa1/Prkaa2 siRNAs (siPrkaa1/siPrkaa2). 48 h post transfection, cells were left untreated (medium, M) or exposed to 10 ng/ml TNF + 30 µM QVD (TQ) with or without 5 µM GSK’872 (G) for 4 h. Then, cells were lysed and cleared cellular lysates were subjected to SDS-PAGE and analyzed by immunoblotting for indicated proteins. The density of each protein band was divided by the average of the density of all bands from the same protein on the membrane. Fold changes were calculated by dividing each normalized ratio (protein to loading control) by the average of the ratios of the control lane (siCtrl, medium). Statistical graphics represents mean + SD (n = 3). Statistical analysis was done by ordinary two-way ANOVA (corrected by Tukey’s multiple comparisons test). Statistically significant differences are only indicated for TQ and TQG (scr vs. Prkaa1/Prkaa2 siRNA) and for TQ vs. TQG (within each treatment). Statistically significant differences to control (siCtrl, medium) are depicted as letters directly above the bars. ** or b: P < 0.01, *** or c: P < 0.001, ns: non-significant. (F) L929 cells were left untransfected or transiently transfected with cDNA encoding 3xFLAG-MmRIPK3 for 24 h. Then untransfected cells were left untreated or exposed to 10 ng/ml TNF + 30 µM QVD (TQ) for 3 h. Cells were lysed and cleared cellular lysates were subjected to SDS-PAGE and immunoblotting for indicated proteins