
Figures & data
Figure 1. Autophagy flux is impaired during the maintenance of neuropathic pain. (A) The thresholds of mechanical allodynia (left) and thermal hyperalgesia (right) after spinal nerve ligation (SNL) were performed before catheter implantation (baseline value, BL), and on days 3, 7, 14 and 28 postsurgery. Each test was repeated 3 times. Data are presented as the mean ± SD. **p < 0.01 vs sham; n = 6 mice/group. (B) Reactive oxygen species (ROS) levels in the dorsal horn (DH) of the spinal cords reflected by 8-hydroxydeoxyguanosine (8-OHdG) immunofluorescence intensity at different time points after SNL. Bar: 50 μm. (C) Statistical results of intensity of 8-OHdG staining in Figure 1B. Data are presented as the mean ± SD. **p < 0.01 vs sham; n = 3 mice/group, 6 slices per mouse were employed. (D) Pro-inflammatory factor levels of IL1B, TNF, CCL7, and MMP2 in spinal cords from a sham 14 d group and SNL 14 d group. **P < 0.01 vs sham; n = 4 mice/group. (E) Double immunofluorescence staining of 8-OHdG (green) with neuron marker RBFOX3/NeuN (red, upper) or astrocyte marker glial fibrillary acidic protein (GFAP, red, down) in the dorsal horn of the spinal cords, SNL 14 d (SNL postoperative 14 d), respectively, n = 4 mice/group, 6 slices per mice were employed. Bar: 50 μm. (F) Western blots of autophagy proteins, including LC3, ATG5, and SQSTM1. ACTB was used as loading control. Data are presented as the mean ± SD (N = 3). *p < 0.05, **p < 0.01 vs Sham; ns: no significance. n = 3 mice/group. (G) The mRNA level of Sqstm1 in spinal cords on day 7, 14 and 28 after SNL. Data are presented as the mean ± SD. ns: no significance; n = 4 mice/group. (H) Representative immunofluorescence images of spinal dorsal cord staining LC3 or SQSTM1 from sham 14 d and SNL 14 d groups. n = 3 mice/group, 6 slices per mouse were employed. Data are presented as the mean ± SD, **p < 0.01 vs Sham
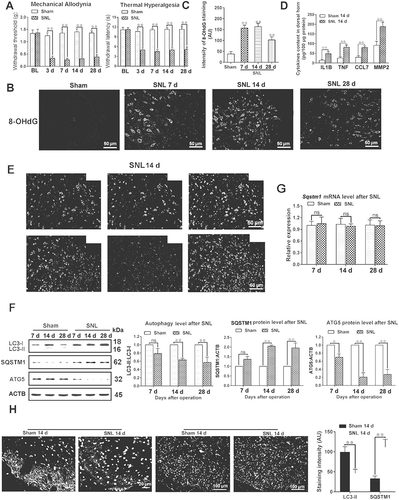
Figure 2. Impaired autophagy flux has mainly existed in astrocytes during the maintenance of neuropathic pain. (A,B) Transmission electron microscopic representative images of spinal cord in sham 14 d and SNL 14 d groups. Black arrows are classic autophagosomes with double membranes. N: nucleus; bar: 1 μm. Statistical histogram of the number of autophagosomes in each electron microscopic field. Data are presented as the mean ± SD. **p < 0.01 vs sham; n = 4 mice/group, 6 slices per mouse were employed. (C,D) Western blots of autophagy flux detection of spinal cord in sham 14 d and SNL 14 d groups. CQ: chloroquine. Data are presented as the mean ± SD (N = 3). *p < 0.05; ns: no significance. n = 4 mice/group. (E,F) Double immunofluorescence staining of SQSTM1 with astrocyte marker GFAP or neuron marker RBFOX3/NeuN, respectively. Statistical results of SQSTM1-positive cell type. Data are presented as the mean ± SD (N = 4). **p < 0.01; n = 3 mice/group, 6 slices per mice were employed. Bar: 50 μm. (G,H) Electron microscopic results of autophagosomes (A) and mitochondria (M) in spinal cords at different time points after SNL. The enlarged mitochondria are shown in the lower images. Bar: 1 μm. The statistical results of the number of autophagosomes and the ratio of length to width of mitochondria were shown. Data are presented as the mean ± SD (N = 3). **p < 0.01 vs sham; n = 4 mice/group, 6 slices per mice were employed
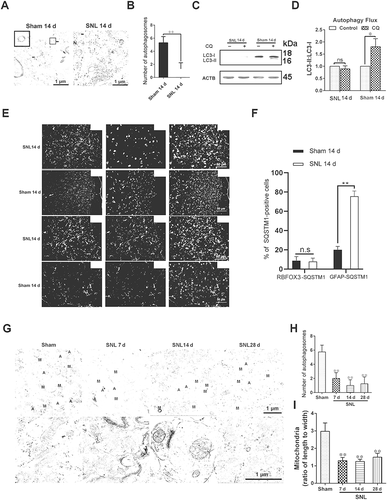
Figure 3. Impaired autophagy promotes the maintenance of neuropathic pain. (A) Effects of different concentrations of autophagy inhibitor 3-methyladenine (3-MA, upper) and autophagy activator rapamycin (Rapa, down) on the thresholds of mechanical allodynia during neuropathic pain maintenance. The paw withdrawal threshold tests were carried out one day before spinal nerve ligation surgery (−1), and at days 7, 10, 14, 21, and 28 after SNL. Each test was repeated 3 times. Data are presented as the mean ± SD, n = 6 mice/group. *p < 0.05, **p < 0.01 vs DMSO group. The black arrow represents the time points of intrathecal administration. (B) Effects of autophagy inhibitor 3-MA (5 μg/d/mouse) and autophagy activator Rapa (5 μg/d/mouse) on the thresholds of mechanical allodynia (upper) and thermal hyperalgesia (down) during neuropathic pain maintenance. Each test was repeated 3 times. Data are presented as the mean ± SD, n = 6 mice/group. **p < 0.01; ns: no significance. (C) Western blots analysis of autophagy marker LC3-II and SQSTM1 in spinal cords after treatment with 3-MA or Rapa, SNL14d (SNL postoperative 14 d). The statistical results of protein levels of LC3-II and SQSTM1 were shown. Data are presented as the mean ± SD, n = 3 mice/group. *p < 0.05, **p < 0.01. (D) Effect of autophagy inhibitor 3-MA and autophagy activator Rapa on the level of neuroinflammation in spinal cords, SNL14d. Data are presented as the mean ± SD, n = 4 mice/group. *p < 0.05; **p < 0.01. (E) Double immunofluorescence staining in the spinal dorsal horn of 8-OHdG (green) and RBFOX3/NeuN, a neuronal marker (red) after treatment with 3-MA or Rapa, SNL14d. Bar: 100 μm. (F) The statistical results of ROS levels in spinal cord neurons after inhibition or activation of autophagy in Figure 3E. Data are presented as the mean ± SD. n = 3 mice/group, 6 slices per mouse were employed. *p < 0.05, **p < 0.01
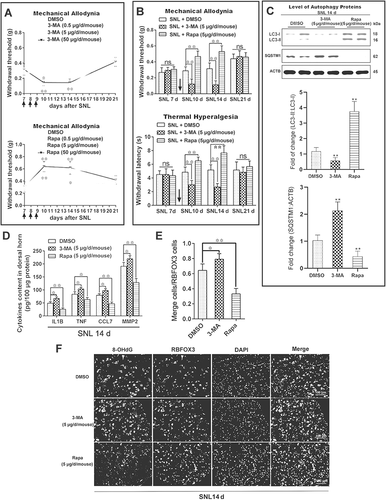
Figure 4. Impairment of autophagy delays the initiation, but promotes the maintenance of the inflammatory response. (A) The levels of inflammatory factors, CCL7 and MMP2, released by primary astrocytes after treatment with IL1B or TNF. Data are presented as the mean ± SD (N = 3). *p < 0.05; **p < 0.01; ns: no significance. (B) Immunofluorescence results of LC3-labeled autophagosomes in primary astrocytes after treatment with IL1B or TNF. The image in the lower right corner is the magnification of the white box. Bar: 100 μm. (C) Statistical results of the number of autophagosomes (LC3 puncta) per astrocyte in Figure 4B. Data are presented as the mean ± SD. **p < 0.01. (D,E) Western blots analysis and statistical result of autophagy marker LC3-II and autophagy receptor SQSTM1 in primary astrocytes after treatment with IL1B or TNF. Data are presented as the mean ± SD (N = 3). *p < 0.05, **p < 0.01 compared with the 0-h group. (F,G) Western blot analysis and statistical result of autophagy marker LC3-II and autophagy receptor SQSTM1 in astrocytes after treatment with autophagy inhibitor 3-MA or Atg7 siRNA. Data are presented as the mean ± SD (N = 3). *p < 0.05, **p < 0.01. (H) The levels of CCL7 (left) and MMP2 (right) released by primary astrocytes after treatment with autophagy inhibitor 3-MA and astrocyte activator IL1B. Data are presented as the mean ± SD (N = 3). *p < 0.05, **p < 0.01 compared with 0 h group; #p < 0.05, ##p < 0.01; ns: no significance. (I) The levels of CCL7 (left) and MMP2 (right) released by primary astrocytes after treatment with autophagy inhibitor 3-MA and astrocyte activator TNF. Data are presented as the mean ± SD (N = 3). *p < 0.05, **p < 0.01 compared with 0 h group; #P < 0.05, ##P < 0.01; ns: no significance. (J) The levels of CCL7 (left) and MMP2 (right) released by primary astrocytes after treatment with autophagy inhibitor Atg7 siRNA and astrocyte activator IL1B. Data are presented as the mean ± SD (N = 3). *p < 0.05, **p < 0.01 compared with 0 h group; #p < 0.05, ##p < 0.01; ns: no significance. (K) The levels of CCL7 (left) and MMP2 (right) released by primary astrocytes after treatment with autophagy inhibitor Atg7 siRNA and astrocyte activator TNF. Data are presented as the mean ± SD (N = 3).*p < 0.05, **p < 0.01 compared with 0 h group; #p < 0.05, ##p < 0.01; ns: no significance
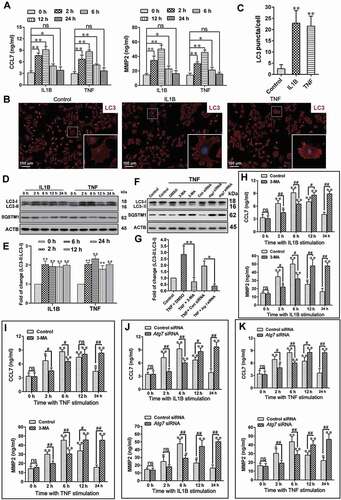
Figure 5. Impaired autophagy increases the levels of neuroinflammatory factors by activating the TRAF6-MAPK8-NFKB signaling pathways. (A) Western blot analysis of p-MAPK8, p-MAPK14, p-MAPK1, and p-RELA in primary astrocytes after treatment with autophagy inhibitor Atg7 siRNA and astrocyte activators IL1B or TNF. (B-E) The statistical results of p-MAPK8 (B), p-RELA (C), p-MAPK14 (D) and p-MAPK1 (E) in Figure 5A. Data are presented as the mean ± SD (N = 3). *p < 0.05, **p < 0.01; ns: no significance. (F,G) Effects of inhibitors (in-) of MAPK8 (SP600125), MAPK14 (SB203580), MAPK1 (U0126), and RELA (JSH-23) on CCL7 (F) and MMP2 (G) release from autophagy impaired astrocytes. Data are presented as the mean ± SD (N = 3). **p < 0.01; ns: no significance. (H) Immunoprecipitation results of K63 ubiquitin proteins and TRAF6 in cultured primary astrocytes after treatment with or without autophagy inhibitor Atg7 siRNA and astrocyte activators IL1B or TNF. (I) Effect of TRAF6 inhibition on levels of p-MAPK8 and p-RELA in autophagy impaired astrocytes after treatment with astrocyte activators IL1B or TNF. (J) The statistical results of ATRAF6, p-MAPK8, and p-RELA in Figure 5I. Data are presented as the mean ± SD (N = 3). **p < 0.01 compared with control (Ctrl) siRNA group. ##p < 0.01 compared with the Atg7 siRNA treated group. (K) Immunoprecipitation results of K63 ubiquitin proteins and TRAF6 in spinal cords after intrathecal injection of autophagy inhibitor 3-MA or activator rapamycin (Rapa) during the maintenance phase of neuropathic pain. (L) Western blots and statistical results of TRAF6 in spinal cord after intrathecal injection of autophagy inhibitor 3-MA or activator rapamycin (Rapa). Data are presented as the mean ± SD (N = 3). n = 4 mice/group. *p < 0.05, **p < 0.01 compared with DMSO group
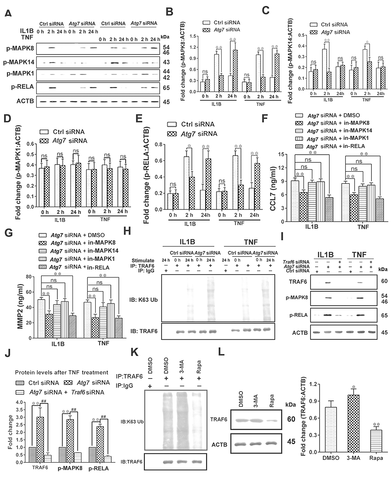
Figure 6. Impaired autophagy of astrocytes reduces the protective effect of antioxidant stress on neurons by reducing GSH release, which can be improved by activating the NFE2L2 pathway. (A) Effect of inhibition (3-MA) or activation (Rapa) of autophagy on reactive oxygen species (ROS) levels of astrocytes as detected by flow cytometry. (B) Statistical results of ROS levels in astrocytes in Figure 6A. Data are presented as the mean ± SD (N = 4). **p < 0.01; ns: no significance. (C) Statistical results of ROS levels in astrocytes after inhibiting autophagy by Atg7 siRNA. Data are presented as the mean ± SD (N = 4). **p < 0.01; ns: no significance. (D) Levels of glutathione in astrocytes (left) and culture media (right) after inhibition (3-MA) or activation (Rapa) of autophagy. Data are presented as the mean ± SD (N = 4). *p < 0.05, **p < 0.01; ns: no significance. (E) Levels of glutathione in astrocytes (left) and culture media (right) after inhibiting autophagy by Atg7 siRNA. Data are presented as the mean ± SD (N = 4). **p < 0.01; ns: no significance. (F) ROS levels in neurons detected by flow cytometry after co-cultured with control (Con) astrocytes or autophagy impaired (AI) astrocytes. (G) Statistical results of ROS levels in neurons co-cultured with control (Con) astrocytes or autophagy impaired (AI) astrocytes. Data are presented as the mean ± SD (N = 4). **p < 0.01; ns: no significance. (H) Levels of glutathione in neurons (left) and culture media (right) after co-cultured with control (Con) astrocytes or autophagy impaired (AI) astrocytes. Data are presented as the mean ± SD (N = 4).**p < 0.01; ns: no significance. (I) Effects of exogenous glutathione added into culture medium on the levels of glutathione and ROS in neurons co-cultured with control (Con) astrocytes or autophagy impaired (AI) astrocytes. Data are presented as the mean ± SD (N = 4). **p < 0.01. (J) Effect of inhibition (Nfe2l2 siRNA) or activation (Keap1 siRNA) of NFE2L2 on glutathione levels released by autophagy-activated astrocytes. Data are presented as the mean ± SD (N = 4).*p < 0.05, **p < 0.01; ns: no significance. (K) Effect of inhibition (Nfe2l2 siRNA) or activation (Keap1 siRNA) of NFE2L2 on glutathione levels released by autophagy impaired astrocytes. Data are presented as the mean ± SD (N = 4). **p < 0.01. (L) Effect of inhibition (Nfe2l2 siRNA) or activation (Keap1 siRNA) of NFE2L2 on ROS levels in neurons co-cultured with autophagy impaired astrocytes. Data are presented as the mean ± SD (N = 4). **p < 0.01; ns: no significance. (M) Effect of inhibition (Nfe2l2 siRNA) or activation (Keap1 siRNA) of NFE2L2 on glutathione levels in neurons (left) and culture media (right) after co-cultured with autophagy impaired astrocytes. Data are presented as the mean ± SD (N = 4). *p < 0.05, **p < 0.01; ns: no significance
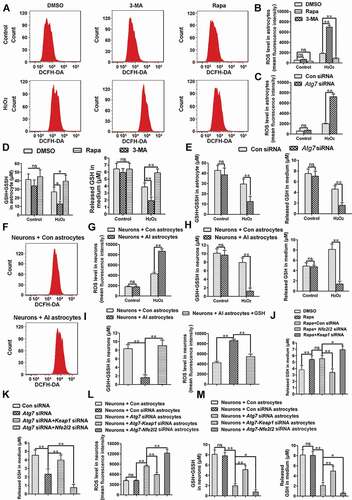
Figure 7. Simultaneous activation of autophagy and the NFE2L2 pathway can further relieve pain, compared to activating autophagy alone. (A,B) Western blot analysis and statistical results of NFE2L2 in spinal cord after spinal nerve ligation (SNL). Data are presented as the mean ± SD (N = 3), n = 4 mice/group. **p < 0.01, ***p < 0.001; ns: no significance. (C) Expression levels of NFE2L2 target genes Gclc, Hmox1, and Nqo1 in spinal cords from the sham 14 d group and SNL 14 d group. Data are presented as the mean ± SD, n = 4 mice/group. **p < 0.01 vs sham group. (D) Immunofluorescence representative images of NFE2L2 protein entering the nucleus. Bar: 50 μm; n = 4 mice/group, 6 slices per mice were employed. (E,F) Double immunofluorescence staining of NFE2L2 with neuron marker RBFOX3/NeuN or astrocyte marker GFAP, respectively. Bar: 100 μm. Data are presented as the mean ± SD, n = 3 mice/group, 6 slices per mice were employed. **p < 0.01. (G,H) Western blot analysis and statistical results of NFE2L2 protein in spinal cord after intrathecal injection of autophagy inhibitor 3-MA or activator rapamycin (Rapa) during the maintenance phase of NPP. Data are presented as the mean ± SD (N = 3), n = 3 mice/group. *p < 0.05, **p < 0.01. (I) Expression levels of NFE2L2 target genes Gclc and Hmox1 in spinal cords after intrathecal injection of autophagy inhibitor 3-MA or activator Rapa. Data are presented as the mean ± SD, n = 4 mice/group. *p < 0.05, **p < 0.01. (J,K) Western blot and statistical results of KEAP1 and NFE2L2 in spinal cord after intrathecal injection of Rapa or AAV containing Keap1 shRNA. Data are presented as the mean ± SD from 3 (N = 3), n = 3 mice/group. **p < 0.01; ##p < 0.01; ns: no significance. (L) Expression levels of NFE2L2 target genes Gclc and Hmox1 in spinal cords after intrathecal injection of Rapa or AAV containing Keap1 shRNA. Data are presented as the mean ± SD, n = 4 mice/group. **p < 0.01; ns: no significance. (M,N) The thresholds of mechanical allodynia and thermal hyperalgesia after intrathecal injection of Rapa or AAV containing Keap1 shRNA. Data are presented as the mean ± SD, n = 6 mice/group. **p < 0.01; ##p < 0.01; ns: no significance. (O) Change of reactive oxygen species in spinal cord neurons after intrathecal injection of Rapa or AAV containing Keap1 shRNA. Bar: 100 μm; n = 4 mice/group, 6 slices per mouse were employed
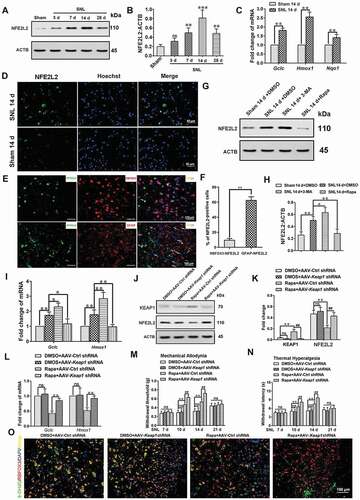
Figure 8. Impaired autophagy can activate NFE2L2 through the SQSTM1-KEAP1 pathway in astrocytes. (A) Western blot analysis of nuclear NFE2L2 protein levels in astrocytes after treatment with autophagy inhibitor Atg7 siRNA and astrocyte activators TNF or H2O2. (B,C) Statistical results of nuclear NFE2L2 protein after treatment with TNF (B) or H2O2 (C) in Fig. 8A. Data are presented as the mean ± SD (N = 3). *p < 0.05, **p < 0.01; ns: no significance. (D,E) Western blot analysis (D) and statistical results (E) of the protein levels of LC3-II, SQSTM1, and NFE2L2 in astrocytes after treatment with H2O2 or 3-MA or rapamycin (Rapa). Data are presented as the mean ± SD (N = 3). *p < 0.05, **p < 0.01. (F) Effect of inhibition of SQSTM1 on the protein levels of KEAP1 and nucleus NFE2L2 in autophagy impaired astrocytes. (G) Statistical results of the protein levels of SQSTM1, KEAP1, and NFE2L2 in Fig. 8 F. Data are presented as the mean ± SD (N = 3). *p < 0.01, **p < 0.01; ns: no significance
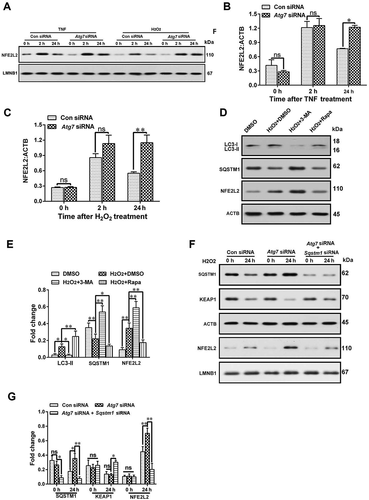
Table 1. Primers used in this study
Table 2. Reagents used in this study