Figures & data
Figure 1. Effect of WLS deficiency on BMDCs. (A) Colony formation of BMDCs with wild-type, heterozygous, or wls-null (wlsfx/fx) genotypes (n = 8). (B and C) Percentage of apoptotic and autophagic BMDCs with wild-type, heterozygous, or wls-null genotypes (n = 8). (D) Western blots of autophagic markers (LC3B, PIK3C3, ATG5, ATG12 and ATG16L1) in lysates of wild-type and wls-null BMDCs (n = 3; p< 0.001). (E) Percentage of apoptotic BMDCs with wild-type and wls-null genotypes by WNT1 and WNT3A treatment. (F) Percentage of autophagic BMDCs with wild-type and wls-null genotypes after WNT1 and WNT3A treatment. (G) Level of cytokine-expressing cells in wild-type or wls-null (wlsfx/fx) BMDCs. (H) Levels of IL12A, IL6, and IL10 secreted by wild-type and wls-null BMDCs, or (I) IFNG and TNF secreted by cocultured CD4+ T cells in the presence or absence of LPS. (J) Spleen size in wild-type and DC-specific wls-null mice with or without LPS treatment. Flow cytometric analysis of the total number of (K) splenocytes and (L) DCs in wild-type and DC-specific wls-null mice after LPS treatment (n = 8; p< 0.001)
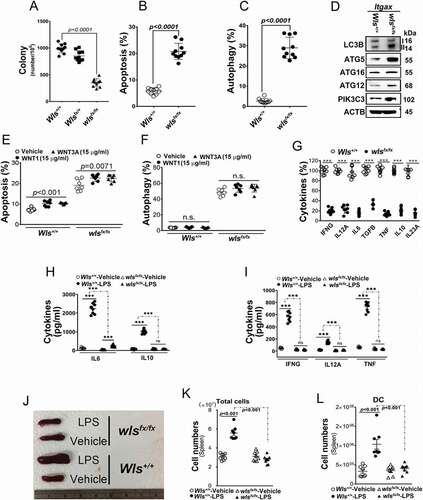
Figure 2. WLS deficiency results in ER stress and the loss of ER quality control. (A) Western blot analysis of UPR sensors, EIF2AK3-ElF2A signals, and calcium regulators in wild-type (+/+), heterozygous (fx/+), and wls-null (fx/fx) Itgax-Cre BMDCs. (B) TEM analysis of the ultrastructure and translational ribosome complex in wild-type and wls-null BMDCs. Red arrow, translational ribosomal complex. (C) intracellular calcium levels in wild-type and wls-null BMDCs following treatment with CCL2 (0.7 nM). (D-F) Western blotting analysis of WLS, ERN1, EIF2AK3, ATF6, HSPA5 CANX, and CALR in anti-WLS, anti-ERN1, and anti-EIF2AK3 immunoprecipitates probed with the respective antibodies in wild-type or wls-deficient BMDCs. Data were generated from three independent experiments. (G) Confocal immunofluorescent imaging of WLS, ERN1, EIF2AK3, and ATF6 in wild-type or wls-null BMDCs. (H-I), Western blot analysis of WLS, ERN1, EIF2AK3, ATF6, HSPA5, CANX, and CALR in anti-WLS immunoprecipitates of BMDCs treated with WNT1 and WNT3A, respectively
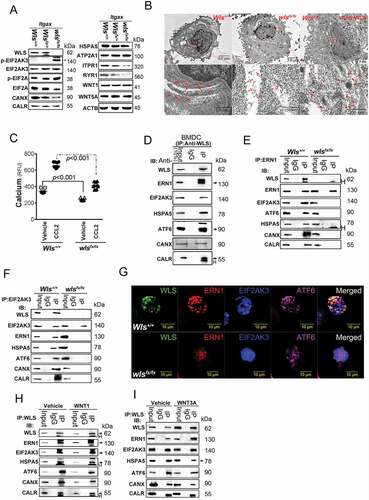
Figure 3. WLS coordinates a multi-protein complex and regulates ER stress response in BMDCs
Figure 4. WLS-mediated molecular chaperone supercomplex modulates protein glycosylation, cytokine secretion, and cell fate in BMDCS. (A) Total glycosylation levels as measured by ELISA in BMDCs with wild-type and wls-null genotypes after TM, BFA, or DTT treatment. (B) Glycosylation levels of different kinds of glycan modification of total proteins determined by phenol-sulfuric acid method. (C) Heatmap of 507 biomarkers in wild-type and wls-null (wlsfx/fx) BMDCs; (D) Comparison of the number of hypoglycosylated proteins between wild-type and wls-null cells. #, hypo-glycosylation, no significance (*, p< 0.05); (E) GO biological process over-representation analysis with 15 signal pathways between wild-type and wls-null cells; (F) Glycosylation levels of CDH5/VE-Cadherin, BMPR1B, TGFBR1, LRP6, FZD1/Frizzled-1, FZD3, FZD4, FZD5, FZD6, and CTNNB1/β-catenin in wild-type and wls-null cells. (G) Glycosylation levels as measured by ELISA in anti-WNT1, WNT3A, and WNT5A immunoprecipitates of wild-type and wls-null BMDC. (H) Levels of WNT1, WNT3A, and WNT5A as measured by ELISA in wild-type and wls-null BMDCs. (I) Glycosylation levels of INS (insulin), IGF1, GRB2, IGF2R, INSR, GCG (glucagon), SLC2A1/GLUT1, SLC2A2, SLC2A3, and SLC2A5 in wild-type and wls-null cells. (J-K) Levels of GCG, glucose, and ATP as measured by ELISA in wild-type and wls-null BMDCs. (L) Glycosylation levels of CD14, TLR1, TLR2, TLR3, TLR4, IFNB, IL6, and TNF in wild-type and wls-null cells. (M) Glycosylation levels of IFNA, IFNG, IFNAR1, IFNGR2, IL10, IL12A, IL23A and TGFA in wild-type and wls-null cells
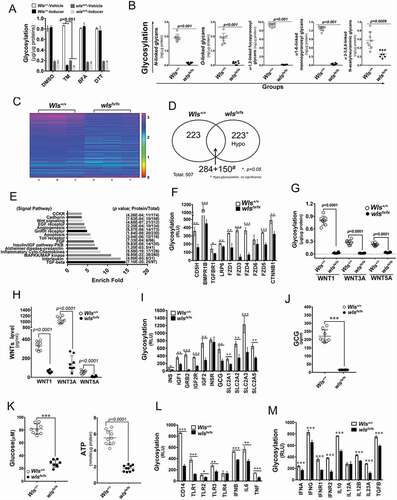
Figure 5. WLS coordinates a multi-protein complex and regulates ER stress response in A549 cells. (A) Wild-type and various deletion mutants of WLS as indicated. (B) Western blot analysis of UPR sensors and CANX-CALR complex expression in anti-GFP immunoprecipitates from wild-type and mutant WLS-transfected A549 cells. Arrow, HSPA5. (C) Western blot analysis of UPR sensors and calcium regulators (ITPR1, RYR1, and ATP2A1) in A549 cells transfected with wild-type or mutant WLS (Arrow, ITPR1). (D) Confocal microscopy imaging of the interaction between WLS and EIF2AK3 in A549 cells transfected with wild-type or WLSΔCT mutants. WLS, green; EIF2AK3, red; and nuclei, blue. (E) Percentage of autophagic A549 cells transfected with wild-type or WLS mutants. (F) Intracellular calcium levels in A549 cells transfected with wild-type or WLS mutants. (G) glycosylation levels as measured by ELISA in A549 cells transfected with wild-type or WLS mutants. Data were generated from three independent experiments for each panel (***, p< 0.001)
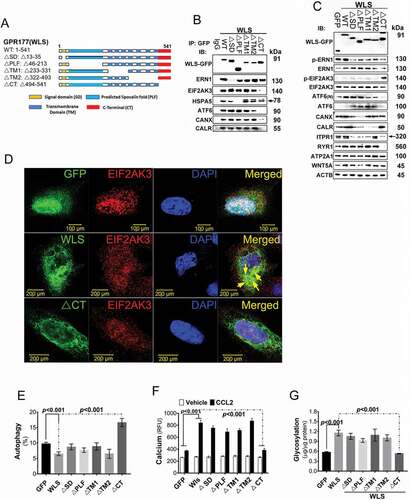
Figure 6. In vivo mouse EAE model. (A) Clinical score (means ± SEM) of MOG35–55-induced EAE in wild-type or DC-specific, wls-null (wlsfx/fx) mice (N = 8 mice/group; ***p < 0.0001). (B-E) Number of DCs, pDCs, cDCs, and CNS-infiltrating Th1, Th17, or Th1/Th17 (CD4+ IFNG+ IL17A+) CD4+ T cells from MOG35–55-induced wild-type and DC-specific wls-null mice on day 21 (N = 8 mice/group; p < 0.001 in two-tailed unpaired t-test; n.s., not significant n ≥ 12). (F) Histological analysis of spinal cords of wild-type and wls-null mice with EAE using hematoxylin & eosin (H&E) staining. (G-K) Total number of inflammatory cells and cell differentials in BALFs after OVA challenge (p < 0.001; n.s., not significant). (L) H&E staining of lung tissues in wild-type and wls-null mice (N = 12)
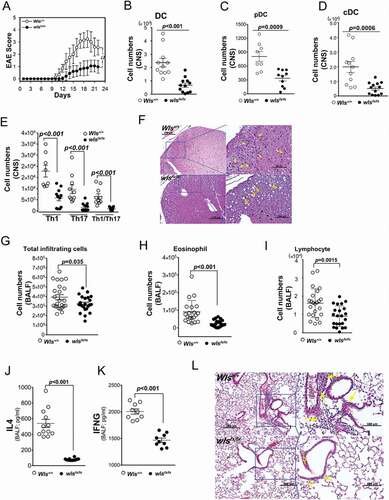
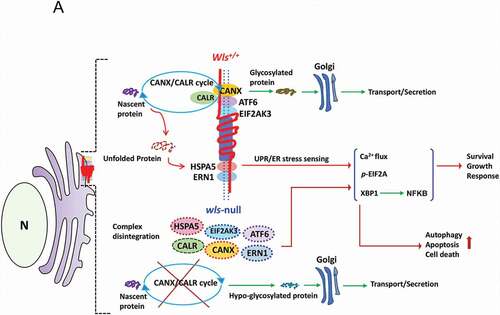
Figure 7. A schematic diagram illustrates a hypothetical model of WLS as an essential chaperone docking ER stress sensors and CANX-CALR complex and controlling ER homeostasis. According to our results, WLS integrates the CANX-CALR cycle, UPR sensors (ERN1, EIF2AK3, ATF6, HSPA5) and calcium regulators (not depicted in the scheme) via different interacting domains. Functionally, the WLS-associated complex controls glycoprotein quality, ER homeostasis and, at least in part, cellular survival, growth and response, whereas WLS deficiency releases UPR sensors and dissociates the CANX-CALR complex, resulting in global hypo-glycosylation and activation of UPR signaling, leading to autophagy, apoptosis and cell death