Figures & data
Figure 1. ZnONPs induced ferroptosis in vascular endothelial cells. (A) MTS analysis of HUVECs treated with 0, 5, 10, 15, 20, 25, 30 and 50 μg/mL ZnONPs for 0, 3, 6, 12 and 24 h. (B) MTS analysis of EA.hy926 cells treated with 0, 5, 10, 15, 20, 25, 30 and 50 μg/mL ZnONPs for 24 h. (C,D) Relative GSH levels in (C) HUVECs or (D) EA.hy926 cells following ZnONPs (20 or 25 μg/mL) treatment for 24 h were determined. (E-F) MDA content in (E) HUVECs or (F) EA.hy926 cells following ZnONPs (15, 20 or 25 μg/mL) treatment for 24 h were determined. (G,H) Representative FACS data for C11-BODIPY labeling of (G) HUVECs or (H) EA.hy926 cells following ZnONPs (20 or 25 μg/mL) treatment for 24 h. Unstained, C11-BODIPY was not added. Statistical analysis of mean fluorescence intensity (MFI) of C11-BODIPY was shown. (I,J) Western blotting analysis of GPX4, ACSL4 and SLC7A11 expression in (I) HUVECs or (J) EA.hy926 cells treated with 0, 5, 10, 15 and 20 μg/mL ZnONPs for 24 h. (K,L) Representative FACS data for PGSK labeling of (K) HUVECs or (L) EA.hy926 cells following ZnONPs (20 or 25 μg/mL) treatment for 24 h. Unstained, PGSK was not added. Statistical analysis of MFI of PGSK was shown. All data are representative of at least three experiments, and the values are expressed as the mean± S.D. *P < 0.05 compared with the mock group
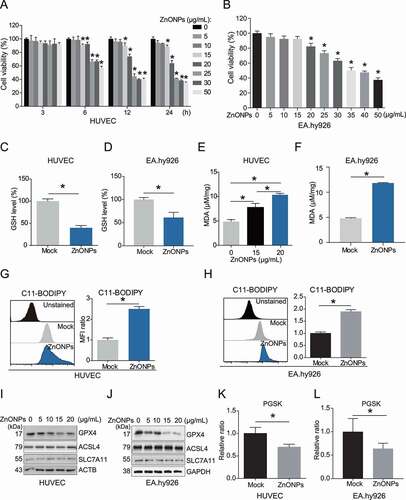
Figure 2. Ferroptosis inhibitors protected from ZnONPs induced vascular endothelial cell death. (A,B) MDA contents in (A) HUVECs or (B) EA.hy926 cells following ZnONPs (20 or 25 μg/mL) treatment with either Fer-1 (1 μM) or DFP (100 μM) for 24 h were measured. (C,D) MTS analysis of cell viability in (C) HUVECs or (D) EA.hy926 cells following ZnONPs (20 or 25 μg/mL) treatment with either Fer-1 (1 μM) or DFP (100 μM) for 24 h. The data are representative of three experiments, and the values are expressed as the mean± S.D. *P < 0.05 compared with the indicated groups, N.S., not significant
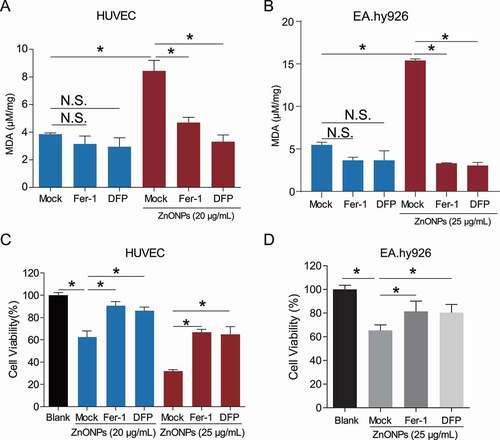
Figure 3. ZnONPs induced autophagy activation in vascular endothelial cells. (A) Representative TEM images of autophagic vacuole in HUVECs following ZnONPs (20 μg/mL) treatment with or without BafA1 (100 nM) for 24 h. Red arrows indicate autophagic vacuole and the autophagic vacuoles per cell was calculated. Scale bar: 1 μm. (B-C) Western blotting analysis LC3B-I/II and SQSTM1 expression levels in (B) HUVECs (C) EA.hy926 cells treated with 0, 5, 10, 15 and 20 μg/mL ZnONPs for 24 h. (D-E) Western blotting analysis LC3B-I/II expression in (D) HUVECs (E) EA.hy926 cells treated with 20 μg/mL ZnONPs for 0, 3, 6 and 12 h. (F) HUVECs or EA.hy926 cells were treated either with BafA1 (100 nM), ZnONPs (20 μg/mL), or BafA1 plus with ZnONPs for 24 h. Confocal images were obtained after formalin fixation of cells (scale bar: 10 μm). Red signal indicated endogenous LC3, nuclei were counterstained with DAPI (blue). Images are representative of three independent experiments. The LC3 puncta per cell in indicated conditions were calculated. (G,J) Western blotting analysis LC3B-I/II and SQSTM1 expression levels in (G) HUVECs or (J) EA.hy926 cells following ZnONPs (20 μg/mL) treatment with or without 3-MA (5 mM) for 0, 6 or 12 h. (H,K) Western blotting analysis LC3B-I/II and SQSTM1 expression levels in (H) HUVECs or (K) EA.hy926 cells following ZnONPs (20 μg/mL) treatment with or without CQ (5 μM) for 0, 6 or 12 h. (I,L) Western blotting analysis LC3B-I/II and SQSTM1 expression levels in (I) HUVECs or (L) EA.hy926 cells following ZnONPs (20 μg/mL) treatment with or without BafA1 (100 nM) for 0, 6 or 12 h. The data are representative of three experiments and the values are expressed as the mean± S.D. *P < 0.05 compared with the indicated groups
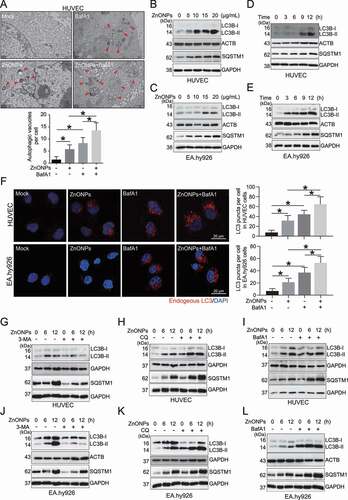
Figure 4. Inhibition of autophagy ameliorated ZnONPs-induced ferroptosis in vascular endothelial cells. (A,E) Western blotting analysis of LC3B-I/II expression in (A) HUVECs or (E) EA.hy926 cells following ZnONPs (20 μg/mL) treatment with or without 3-MA (5 mM) for 24 h. (B,F) Relative ratio of PGSK in (B) HUVECs or (F) EA.hy926 cells following ZnONPs (20 or 25 μg/mL) treatment with or without 3-MA (5 mM) for 24 h were determined. (C,G) Relative MDA content in (C) HUVECs or (G) EA.hy926 cells following ZnONPs (20 or 25 μg/mL) treatment with or without 3-MA (5 mM) for 24 h were measured. (D,H) MTS analysis of cell viability in (D) HUVECs or (H) EA.hy926 cells following ZnONPs (20 or 25 μg/mL) treatment with or without 3-MA (5 mM) for 24 h. (I) Western blotting analysis ATG5 and LC3B-I/II expression in wild-type (WT) or ATG5 knockout (KO) HUVECs treated with mock or ZnONPs (20 μg/mL). (J) Relative ratio of PGSK in WT or ATG5 KO HUVECs treated with mock or ZnONPs were determined. (K) MDA content in WT or ATG5 KO HUVECs treated with mock or ZnONPs for 24 h were measured. (L) MTS analysis of WT or ATG5 KO HUVECs treated with mock or ZnONPs for 24 h were measured. The data are representative of three experiments, and the values are expressed as the mean± S.D. *p < 0.05 compared with the indicated groups, N.S., not significant
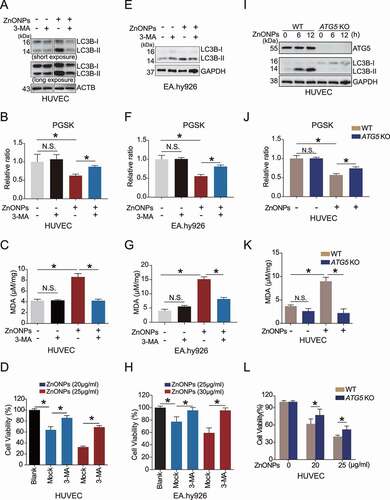
Figure 5. ZnONPs exposure led to ferritinophagy in vascular endothelial cells. (A,C) Western blotting analysis NCOA4 and FTH1 expression in (A) HUVECs or (C) EA.hy926 cells treated with 0, 5, 10, 15 and 20 μg/mL ZnONPs for 24 h. (B,D) Western blotting analysis NCOA4 and FTH1 expression in (B) HUVECs or (D) EA.hy926 cells treated with 20 μg/mL ZnONPs for 0, 3, 6, 9 or 12 h. (E,H) Western blotting analysis of FTH1 and NCOA4 expression levels in (E) HUVECs or (H) EA.hy926 cells following ZnONPs (20 μg/mL) treatment with or without 3-MA (5 mM) for 0, 6, or 12 h. (F,I) Western blotting analysis of FTH1 and NCOA4 expression levels in (F) HUVECs or (I) EA.hy926 cells following ZnONPs (20 μg/mL) treatment with or without BafA1 (100 nM) for 0, 6, or 12 h. (G,J) Western blotting analysis of FTH1 and NCOA4 expression levels in (G) HUVECs or (J) EA.hy926 cells following ZnONPs (20 μg/mL) treatment with or without CQ (5 μM) for 0, 6, or 12 h. (K) Colocalization of endogenous FTH1 (green signal) and LC3 (red signal) in HUVECs following ZnONPs (20 μg/mL) treatment with or without BafA1 (100 nM) for 24 h were determined by immunofluorescence analysis. Nuclei were counterstained with DAPI (blue signal). Images are representative of three independent experiments. Note that the white arrows indicated possible colocalization of FTH1 and LC3. (L) Immunoprecipitation analysis of NCOA4-FTH1 formation in NCOA4-MYC overexpression HUVECs following ZnONPs (20 μg/mL) treatment with or without BafA1 (100 nM) for 24 h. (M) FTH1 and SQSTM1 expression levels in WT or ATG5 KO HUVECs following ZnONPs (20 μg/mL) treatment for 0, 6 or 12 h were determined. The data are representative of three experiments
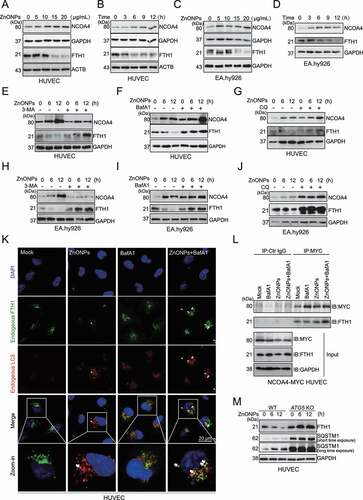
Figure 6. NCOA4 knockdown rescued ferroptosis induced by ZnONPs in vascular endothelial cells. HUVECs or EA.hy926 cells were transfected with 75 nM negative control siRNA (si-NC) or specific NCOA4 siRNA (si-NCOA4) for 48 h before ZnONPs (20 or 25 μg/mL) exposure. (A,D) Western blotting analysis NCOA4 and FTH1 expression was performed in (A) HUVECs or (D) EA.hy926 cells treated with ZnONPs for 24 h. (B,E) MDA contents were measured in (B) HUVECs or (E) EA.hy926 cells treated with ZnONPs for 24 h. (C,F) MTS analysis was performed in (C) HUVECs or (F) EA.hy926 cells treated with ZnONPs for 24 h. The data are representative of three experiments, and the values are expressed as the mean± S.D. *P < 0.05 compared with the indicated groups, N.S., not significant
Figure 7. AMPK-ULK1 axis was probably involved in ZnONPs-induced ferritinophagy. (A-B) Western blotting analysis of p-MTOR, MTOR, p-PRKAA, PRKAA, p-ULK1 and ULK1 expression in (A) HUVECs or (B) EA.hy926 cells treated with 0, 5, 10, 15 and 20 μg/mL ZnONPs for 24 h. (C-D) The knockdown efficacy of siRNA against (C) AMPK or (D) ULK1 in HUVECs was determined by western blot analysis. (E,F) The levels of (E) C11-BODIPY or (F) PGSK in negative control knockdown, AMPK knockdown or ULK1 knockdown HUVECs following ZnONPs (20 μg/mL) treatment for 24 h were determined by FACS analysis. The values of MFI of C11-BODIPY and PGSK in each group were presented. (G) FTH1 and LC3B-I/II expression level in negative control knockdown, AMPK knockdown or ULK1 knockdown HUVECs following ZnONPs (20 μg/mL) treatment for 24 h were determined by western blot analysis. (H) MTS analysis of negative control knockdown (si-NC), AMPK knockdown or ULK1 knockdown HUVECs following ZnONPs (20 μg/mL) treatment for 24 h. (I) NCOA4 expression level in shRNA-control or shRNA-mediated NCOA4 stable knockdown HUVECs were determined. (J) MTS analysis of negative control knockdown, AMPK knockdown or ULK1 knockdown in shRNA-control or shNCOA4 HUVECs following ZnONPs (20 μg/mL) treatment for 24 h. The data are representative of three experiments, and the values are expressed as the mean± S.D. *P < 0.05 compared with the indicated groups, N.S., not significant
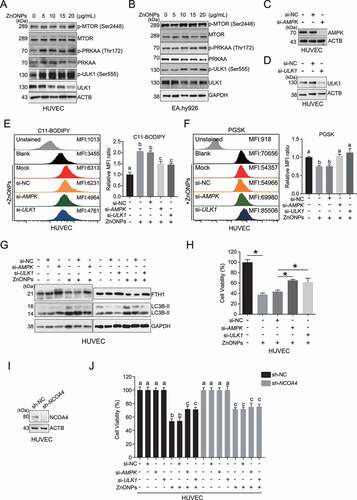
Figure 8. Mitochondrial oxidative stress triggered ZnONPs-induced ferroptosis in vascular endothelial cells. (A) Representative TEM images of mitochondria in HUVECs treated with mock or ZnONPs (20 or 25 μg/mL) for 24 h. Yellow arrows indicated either normal mitochondria (upper panel) or aberrant mitochondria (bottom panel). C, cytoplasm; N, nucleus. Scale bar: 1 μm in left panel and scale bar: 200 nm in right panel. (B) Confocal microscopy analysis of ATP5B in HUVECs or EA.hy926 cells treated with mock or ZnONPs (20 μg/mL) for 24 h. Scale bar: 20 μm. (C,D) Representative FACS data for TMRE labeling of (C) HUVECs or (D) EA.hy926 cells treated with mock or 20 μg/mL ZnONPs for 24 h. (E-F) Representative FACS data for MitoSOX labeling of (E) HUVECs or (F) EA.hy926 cells treated with mock or 20 μg/mL ZnONPs for 24 h. (G,J) p-PRKAA, PRKAA, p-ULK1 (Ser555), ULK1, LC3B-I/II and FTH1 expression levels in (G) HUVECs or (J) EA.hy926 cells following ZnONPs (20 μg/mL) treatment with or without MitoTEMPOL (20 μM) for 24 h were determined. (H,K) MDA content levels in (H) HUVECs or (K) EA.hy926 cells following ZnONPs (20 μg/mL) treatment with or without MitoTEMPOL (20 μM) for 24 h were determined. (I,L) MTS analysis of (I) HUVECs or (L) EA.hy926 cells following ZnONPs (20 μg/mL) treatment with or without MitoTEMPOL (20 μM), NAC (10 mM), TPEN (1 μM) or DTPA (1 mM) for 24 h. *P < 0.05. The data are representative of three experiments, and the values are expressed as the mean± S.D. *P < 0.05 compared with indicated groups
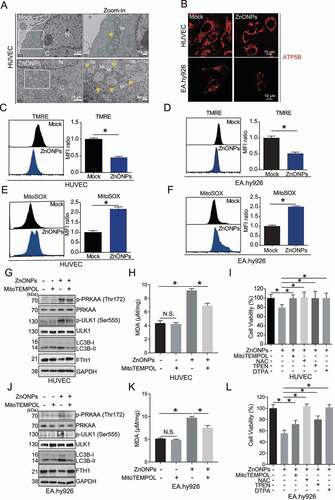
Figure 9. ZnONPs pulmonary exposure-induced vascular injury in mice was likely associated with ferritinophagy-mediated ferroptosis activation. (A) The experimental design of in vivo study. The detailed information was described in the Materials and Methods section. (B) Representative TEM images of mice vascular endothelial cells treated with vehicle or ZnONPs (12 μg/mice) for 3 d. Note that red arrows indicated either normal mitochondria (left panel) or aberrant mitochondria (right panel), blue arrows indicated autophagic vacuoles. Scale bar: 2 μm in the upper panel and scale bar: 1 μm in the bottom panel. (C–G) Relative mRNA expression levels of indicated cytokines in the blood vessels of mice treated with or without ZnONPs were determined. (H) The MDA contents in the vein of mice were determined. (I) Relative mRNA expression level of Ptgs2 in the vein of mice was determined. (J) The expression levels of GPX4, SLC7A11 and MT-CO2/COX2 in the blood vessels of mice were determined and the relative expression ratios were calculated in (K). (L) The expression levels of p-PRKAA, PRKAA, p-ULK1, ULK1, LC3B and FTH1 in the blood vessels of mice were determined and the relative expression ratios were calculated in (M). The data are representative of three experiments, and the values are expressed as the mean± S.D. *P < 0.05 and **P < 0.01
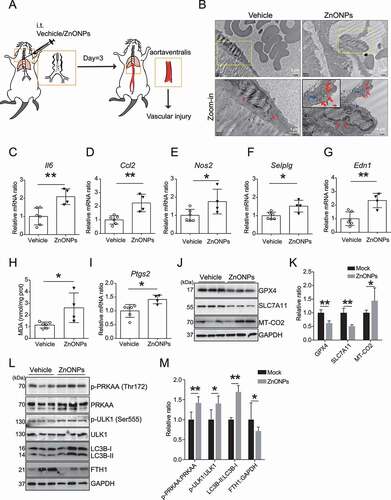
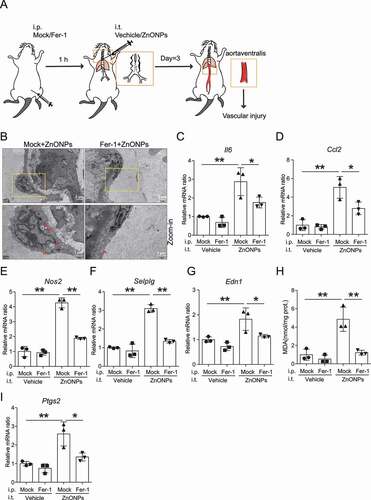
Figure 10. Inhibition of ferroptosis with Fer-1 ameliorated vascular injury induced by pulmonary ZnONPs exposure. (A) The experimental design of in vivo rescue study. The detailed information was described in the Materials and Methods section. (B) Representative TEM images of vascular endothelial cells in mice following with pulmonary ZnONPs exposure (12 μg/mice) with or without Fer-1 (10 mg/kg) for 3 d. Note that red arrows indicated either aberrant mitochondria (left panel) or normal mitochondria (right panel). Scale bar: 2 μm in the upper panel and scale bar: 1 μm in the bottom panel. (C–G) Relative mRNA expression levels of indicated cytokines in the blood vessels of mice following with pulmonary ZnONPs exposure (12 μg/mice) with or without Fer-1 (10 mg/kg) for 3 d were determined. (H) The MDA contents in the blood vessels of mice following with pulmonary ZnONPs exposure (12 μg/mice) with or without Fer-1 (10 mg/kg) for 3 d were determined. (I) Relative mRNA expression level of Ptgs2 in the blood vessels of mice following with pulmonary ZnONPs exposure (12 μg/mice) with or without Fer-1 (10 mg/kg) for 3 d was determined. The data are representative of three experiments, and the values are expressed as the mean± S.D. *P < 0.05 and **P < 0.01