Figures & data
Figure 1. ULK1 upregulation is associated with neointima formation in mice subjected to carotid artery ligation (CAL). (A-B) C57BL/6 J mice were subjected to CAL, ULK1 protein levels in carotid arteries were determined by immunohistochemistry 28 d after injury. Scale bar: 50 µm. (C-D) immunohistochemical staining for SQSTM1. Scale bar: 50 µm. (E) Representative images of Verhoeff Van Gieson (VVG) and hematoxylin and eosin (H&E) staining. White triangle indicates media area, black triangle indicates neointima area. Scale bar: 50 µm. IEL, internal elastic layer; EEL, external elastic layer. (F) Quantitative analysis of lumen area and lumen:media ratio in sham and CAL mice. **P< 0.01, n = 5 in each group. (G) Five days after injury, arteries were collected, opened longitudinally, spread onto an agar plate with the luminal surface facing upward, and immunostained for ACT2A/α-SMA (actin alpha 2), a specific marker of smooth muscle cells. Scale bar: 20 µm. n = 5 in each group
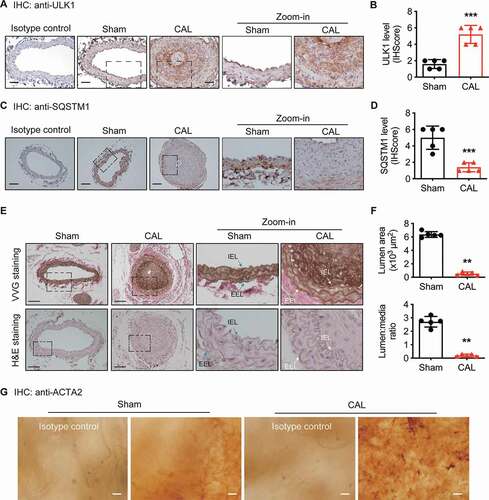
Figure 2. Gene silencing of ULK1 inhibits vascular smooth muscle cell migration in response to PDGF. (A-D) Human aortic smooth muscle cells (HASMCs) were treated with PDGF (platelet-derived growth factor BB, 20 ng/ml) for 12 and 24 h, and protein levels of ULK1, SQSTM1, and LC3 were measured by western blot and densitometry, *P< 0.05, n = 3–4. (E-F) GFP-LC3-expressing HASMCs were treated with PDGF, chloroquine (CQ, 3 µM), or PDGF + CQ for 24 h. (E), Representative images of GFP-LC3 staining. Scale bar: 20 µm. (F) Quantitation of autophagic vacuoles (AV) per cell. n = 3–4, *P< 0.05 vs. Ctrl (control); #P< 0.05 vs. PDGF or CQ. (G-J) Western blot analysis of ULK1, SQSTM1, and LC3 in HASMCs transfected with siCtrl (control siRNA) or siULK1 (ULK1 siRNA). n = 3–4, **P< 0.01, vs. siCtrl. (K-L) HASMCs were transfected with siCtrl or siULK1 for 48 h and treated with PDGF (20 ng/ml) for 24 h. (K) Cell migration was determined by transwell migration assays. Scale bar: 20 µm. (L) Migrated cells were quantified. n = 3–4, *P< 0.05 vs. siCtrl. #P< 0.05 vs. PDGF/siCtrl
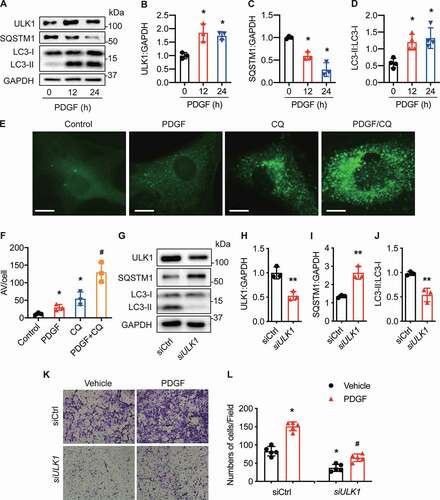
Figure 3. Deletion of Ulk1 in VSMCs inhibits autophagic flux and attenuates neointimal formation. (A) Western blot analysis of ULK1 levels in vascular smooth muscle cells (VSMCs) and endothelial cells (EC) from wild-type (WT) and ulk1 KO mouse aortas. (B) Messenger RNA expression in VSMCs isolated from WT and ulk1 KO mice was analyzed by RT-PCR. (C-D) Protein levels of SQSTM1 and LC3 in VSMCs from WT and ulk1 KO mouse aortas. n = 5, *P< 0.05 vs. WT. (E-F) WT and ulk1 KO VSMCs were treated with or without PDGF (20 ng/ml) for 24 h. Cell migration was measured by scratch wound assay. (E) Representative images of VSMC migration in scratch wound assay. Scale bar: 1 mm. (F) Quantification of wound closure of VSMCs. n = 5, *P< 0.05 vs. WT. #P< 0.05 vs. WT PDGF. (G-H) Carotid artery sections from WT and ulk1 KO mice subjected to sham or carotid artery ligation (CAL) were collected and stained with hematoxylin and eosin to evaluate neointima formation. (G) Representative images of WT and ulk1 KO mice subjected to sham operation and carotid artery ligation. The white triangle indicates vascular media area, the black triangle indicates neointima area. Scale bar: 50 µm. (H) Quantitative analysis of lumen:media ratio in WT and ulk1 KO mice. **P< 0.01, n = 5. ##P< 0.01 vs. WT CAL. (I), Representative images of immunostaining of ACTA2. (J-K) Seven days after CAL, carotid arteries were collected and immunostained to evaluate reendothelialization. (J) Representative immunostaining images for PECAM1 (red, EC marker) and ACTA2 (green, smooth muscle cell marker). Scale bar: 100 µm. (K) Reendothelialization was calculated as the ratio of the surface covered by PECAM1-positive cells to the total luminal surface, n = 5 in each group
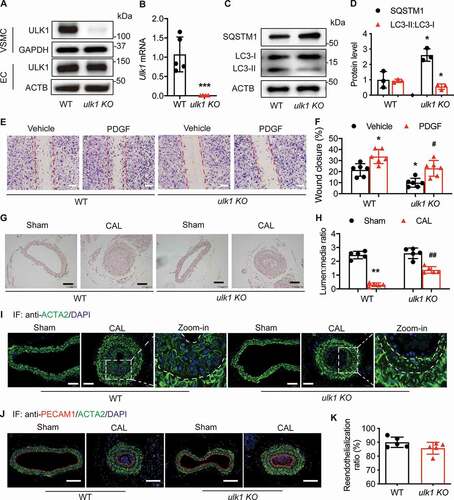
Figure 4. Deletion of ULK1 inhibits VSMC migration ex vivo. (A) Aortic rings without adventitia and endothelial cells from wild-type (WT) mice were treated with PDGF (20 ng/ml) for 7 d, then VSMC migration was analyzed by microscopy. Red arrow indicates the sprout VSMC. Scale bar: 100 µm. (B) The identities of migration cells were determined by immunostaining with antibodies against ACTA2 or PECAM1. Scale bar: 50 µm. (C-D) The aortic rings from WT and ulk1 KO mice were embedded in Matrigel and incubated in DMEM/F-12 medium. Images were taken with a microscope equipped with a digital camera and cell migration was determined by measuring the distance between the rings and the leading front of migrating cells. (C) Representative images of aortic ring assay. Red arrow indicates the sprout VSMC. Scale bar: 100 µm. (D) Quantification of sprout distance. n = 4, **P< 0.01. (E) Quantification of the area under sprout. n = 4, ***P< 0.001
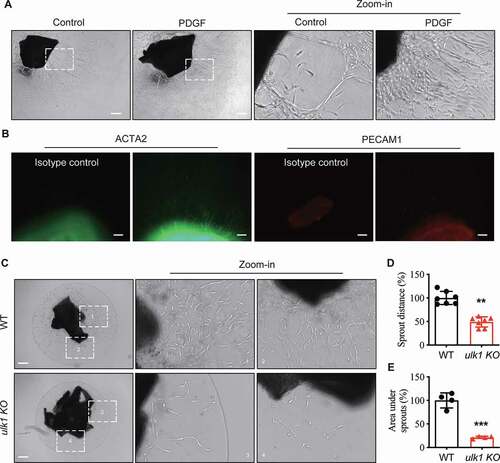
Figure 5. Ulk1 deletion increases acetylated TUBA protein levels. (A-B) Western blot analysis of Ac-TUBA in WT and ulk1 KO mouse VSMCs. n = 6, *P < 0.05 vs. WT. (C) HASMCs transfected with siCtrl (control siRNA) or siULK1 (ULK1 siRNA) were incubated at 0°C for 0, 5, 10, or 15 min. The morphology of microtubules was examined by immunostaining of TUBA. (D) Quantitative analysis of microtubule intensity (n= 25/group, *P< 0.05, ***P< 0.001). (E) HASMCs were transfected with siCtrl or siULK1 and subjected to scratch wound assay. HASMCs stained with TUBA (green) and Ac-TUBA (red) antibodies were analyzed using a confocal microscope. Nuclei were stained with DAPI (blue). Scale bar: 50 µm. (F) WT or ulk1 KO mice were subjected to carotid artery ligation (CAL), and carotid artery sections were stained with Ac-TUBA antibody. Representative images of immunofluorescence staining of Ac-TUBA. Scale bar: 100 µm. (G) Quantification of immunostaining for Ac-TUBA. n = 5, *P< 0.05, **P< 0.01 vs. WT sham. #P< 0.05 vs. ulk1 KO sham
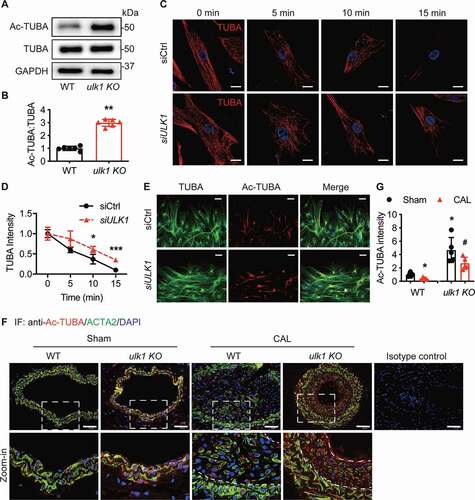
Figure 6. Ulk1 deletion leads to KAT2A accumulation that mediates the acetylation of TUBA. (A) Western blot analysis of the expression of KAT2A, TUBA, and Ac-TUBA in WT and ulk1 KO VSMCs, n= 6. (B) HASMCs were transfected with an adenovirus encoding GFP-LC3 for 24 h and then treated with chloroquine (CQ, 5 µM) for 16 h. KAT2A was stained by immunocytochemistry, and the co-localization (yellow) of KAT2A (red) and GFP-LC3 puncta was evaluated by immunofluorescence microscopy. Scale bar: 10 µm. (C) VSMCs isolated from WT or ulk1 KO mice were treated with CQ (5 µM) for 24 h and the interaction of KAT2A and LC3 were analyzed by immunoprecipitation (IP) and western blot (WB). (D) HASMCs were transfected with siCtrl (control siRNA) or siULK1 (ULK1 siRNA), and levels of ULK1, KAT2A, TUBA, and Ac-TUBA were measured by western blot. n = 6. (E-G) HASMCs were starved with Hank’s balanced salt solution (HBSS) for 3 h, and protein levels of SQSTM1 and LC3 were analyzed by western blot. n = 3, *P< 0.01 vs. Ctrl. (H-J) Levels of KAT2A, TUBA, and Ac-TUBA were measured using western blot. *P < 0.01, n = 3. (K) Purified porcine brain TUBA protein was incubated with recombinant KAT2A-catalytic domain protein in acetylation buffer at 37°C for 1 h. The acetylation of TUBA was assessed by western blot (n= 3, *P< 0.05, **P< 0.01). (L-M) WT and ulk1 KO VSMCs were transfected with siCtrl (control siRNA) or siKat2a (Kat2a siRNA) for 72 h, and protein levels of ULK1, KAT2A, TUBA, and Ac-TUBA were detected by western blot. * P< 0.05 vs. WT siCtrl, #P< 0.05 vs. ulk1 KO siCtrl, n = 4
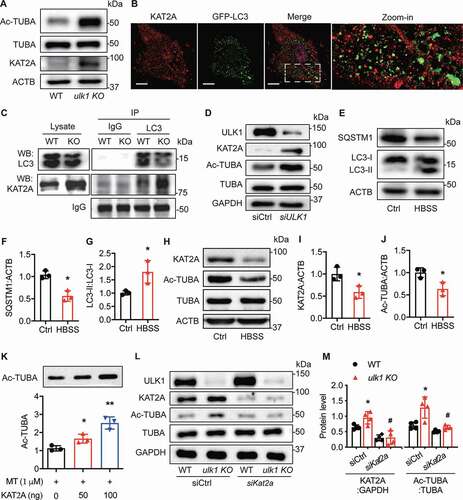
Figure 7. Silencing Kat2a increases neointima formation in ulk1 KO mice subjected to carotid artery ligation. Left carotid arteries of WT and ulk1 KO mice were ligated and right carotid arteries were collected as sham controls. Both left and right arteries were treated with siCtrl (control siRNA) or siKat2a (Kat2a siRNA) after the surgery. Four weeks after ligation, hematoxylin and eosin staining was performed on the paraffin sections of carotid arteries to detect neointimal formation, and immunofluorescence staining was used to detect protein levels of KAT2A and acetylation of TUBA (Ac-TUBA). (A) Representative images of immunofluorescence staining of KAT2A. Scale bar: 50 µm. (B) Quantification of immunofluorescence staining for KAT2A. *P< 0.05, **P< 0.01, n = 5. (C) Representative images of immunofluorescence staining of Ac-TUBA. Scale bar: 50 µm. (D) Quantification of immunofluorescence staining for Ac-TUBA, *P< 0.05, **P< 0.01, n = 5. (E) Representative H&E staining to show neointima formation. Scale bar: 100 µm. (F) Quantitative analysis of lumen:media ratio in WT and ulk1 KO mice. n = 5. **P< 0.01 vs. WT sham, ##P< 0.01 vs. WT CAL
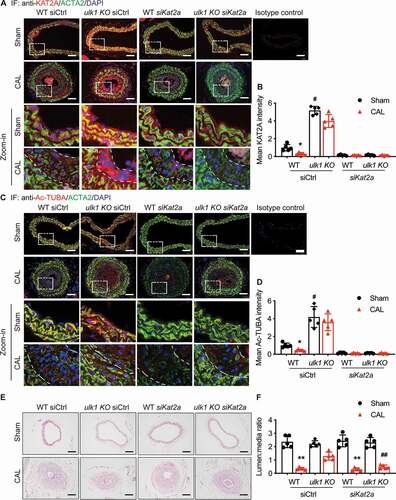
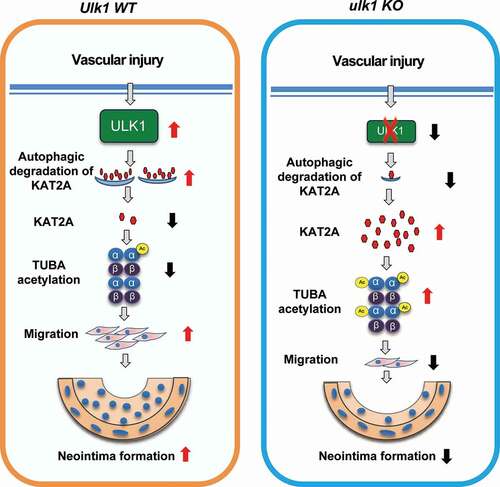
Figure 8. Proposed scheme for the role of ULK1 in neointima formation following vascular injury. Deletion of Ulk1 in VSMCs results in KAT2A accumulation and thus increases TUBA acetylation, which inhibits VSMC migration and neointima formation through modulating microtubule stability and cell motility