Figures & data
Figure 1. CUL3 interacts with BECN1. (A) BECN1 protein or mRNA downregulation overlap in different tumor samples. (B) The low expression of BECN1 was not due to the transfectional repression or gene copy number deletion. (C) HeLa cells were treated with the indicated inhibitors for 24 h and immunoblotting was performed. (D) 231 cells were treated with indicated concentration of MG132 for 24 h and the protein extracts was subjected to immunoblotting. (E) 293 t cells transfected with plasmids encoding Flag-BECN1, treated with 10 μM MG132 for 6 h, and the BECN1 immunoprecipitation were subjected to SDS-PAGE and then analyzed by mass spectrum. The peptide fragment of CUL3 was shown. (F) 293 t cells were transfected with indicated plasmids, the immunoprecipitation was performed by using Flag affinity gels or anti-MYC-tag antibody, and then bloted for the indicated proteins. (G) The illustration of BECN1 deletion mutants. (H) The binding site of BECN1 and CUL3 is near BH3 domain. 293 t cells were transfected with indicated plasmids, the immunoprecipitation of Flag affinity gels was subjected to immunoblotting assay
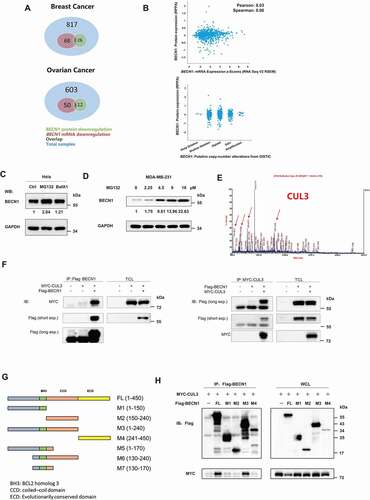
Figure 2. CUL3 attenuates proteasomal degradation of BECN1. (A) The protein lysates of the indicated cell lines were analyzed by western blot by using anti-BECN1 or CUL3. (B) The RNA of the indicated cell lines was extracted and the expression of BECN1 and CUL3 were analyzed by qRT-PCR. (C) CUL3 affects the protein expression of BECN1. MDA-MB-231 cells were transfected with siRNA targeting CUL3, or plasmids encoding CUL3, for 48 h. The protein extracts were subjected to the immunoblotting with indicated antibodies. (D) Knockdown of CUL3 does not affect the transcription of BECN1. MDA-MB-231 cells were transfected with siRNA targeting CUL3, and the expression of BECN1 or CUL3 was detected by qRT-PCR. (E) CUL3 regulates the degradation of BECN1 protein. Hela cells transfected with CUL3 siRNA were treated with 20 μM CHX for the indicated time, and the protein extracts were subjected to the immunoblotting assay. (F) CUL3 promotes the proteasomal degradation of BECN1. MDA-MB-231 cells transient overexpressing with MYC-CUL3 were treated with 100 nM BafA1 or 10 μM MG132 for 6 h, and then assayed for immunoblotting. CUL3 ubiquitin ligase inhibits autophagy. (G) MDA-MB-231 cells were transfected with siRNA targeting CUL3 for 48 h. Cells were treated with BafA1 for 6 h and the cell lysates were detected by immunoblot. (H) Hela cells overexpressing EYFP-LC3 were transfected with the indicated siRNAs for 48 h, and then be fixed and subjected to immunofluorescence assay. Scale bars: 10 μm. (I) MDA-MB-231 cells were transfected with the indicated siRNA for 48 h. Cell lysates were subjected to immunoblotting assay. (J) CUL3 does not affect the formation of BECN1 complex. 293 t cells transfected with siRNA targeting CUL3 and the immunoprecipitation was performed by using anti-BECN1 antibody. The formation of BECN1 complex was analyzed by western blot using the indicated antibodies
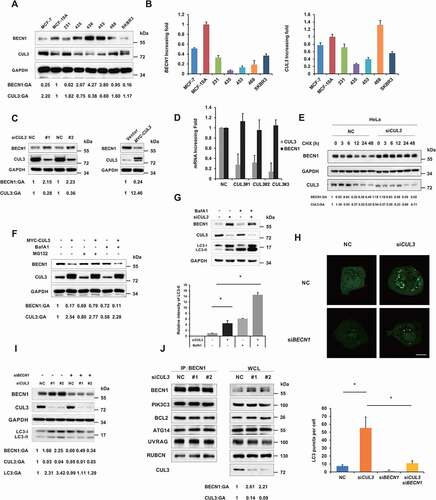
Figure 3. CUL3 promotes K48-linked ubiquitination of BECN1. (A) The ubiquitination of BECN1 decreased with CUL3 deletion. 293 t cells were transient transfected with siRNA targeting CUL3, incubated with 10 μM MG132 for 6 h, and then anti-BECN1 immunoprecipitation and immunoblotting was performed. (B) CUL3 increases BECN1 ubiquitination. 293 t cells were transfected with HA-ubiquitin, MYC-CUL3 and Flag-BECN1, and treated with 10 μM MG132 for 6 h. The immunoprecipitation and immunoblotting was performed by using the indicated antibodies. (C,D) The ubiquitination of BECN1 is K48-linked. 293 t cells were transfected with indicated plasmids, and immunoprecipitation with Flag affinity gels and immunoblotting were performed. (E) The prediction of BECN1 ubiquitination site by using Ubpred. (F) 293 t cells were transfected with HA-ubiquitin and different mutant BECN1 plasmids, and the immunoprecipitation with Flag affinity gels and immunoblotting were performed
Figure 4. KLHL38 is the adaptor that targets BECN1 for ubiquitination and degradation. (A) The expression of CUL3 adaptors in breast cancer tissue compared to normal tissue. (B) KLHL38 affects the expression of BECN1. MDA-MB-231 cells were transfected with indicated siRNAs, and the expression of BECN1 is determined by immunoblotting. (C) The effect of KLHL38 siRNAs on the transcription of BECN1 was determined by qRT-PCR. Data are represented as the mean ± SD. (D) CUL3 complex promotes the proteasomal degradation of BECN1. MDA-MB-231 cells were transfected with indicated plasmids, treated with MG132 for 6 h, and the expression of BECN1 is determined by immunoblotting. (E) KLHL38 interacts with BECN1. 293 t cells overexpressing KLHL38 and BECN1 were treated with 10 μM MG132 for 6 h, and the immunoprecipitation was performed. (F) Knockdown of KLHL38 affects BECN1 ubiquitination. 293 t cells were transfected with the indicated plasmids or siRNAs and the immunoprecipitation was performed
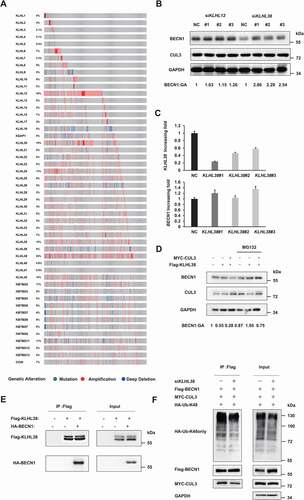
Figure 5. CUL3 mediated tumorigenesis through BECN1 degradation. (A), (B) Hela or 231 cells were transfected with siRNAs targeting CUL3 for the indicated days. Cell viability was measured by MTT assay. (C) 231 cells are transfected with siRNA targeting KLHL38 for the indicated days. Cell viability is measured by MTT assay. (D-F,H), Cells were transfected with indicated siRNAs or plasmids and the clone formation assay was performed. Cells were fixed and stained by crystal violet. (G) 231 cells were transfected with plasmids encoding MYC-CUL3 for the indicated days. Cell viability was measured by MTT assay. (I) left, 231 cells stable transfected with shRNA targeting CUL3 were treated with the indicated amount of CQ. Cell viability was measured by MTT assay. right, 231 cells overexpressing CUL3 were treated with indicated amount of MLN4924 for 24 h. Cell viability was measured by MTT assay
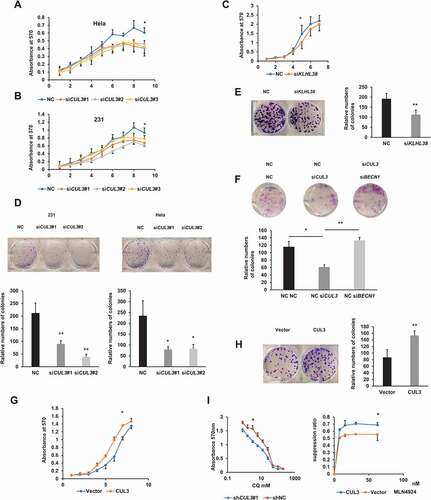
Figure 6. The model that CUL3-KLHL38-mediated BECN1 degradation inhibits autophagy and promotes tumor progression
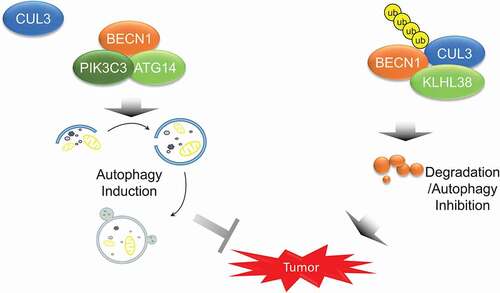
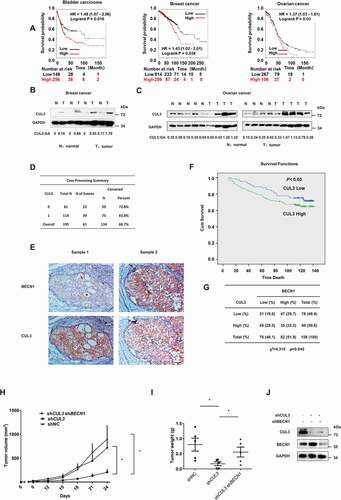
Figure 7. CUL3 mediated BECN1 degradation is relevant both in patients and in tumorigenicity model of nude mice. (A) Online analyses of survival in Bladder carcinoma, Breast cancer or Ovarian cancer patients with high or low CUL3 expression. The number of surviving patients at different time points is indicated below the graphs. HR, hazard ratio. (B,C) Immunoblotting analyses of CUL3 protein expression in tumor samples and normal samples of breast cancer or ovarian cancer patients. (D,F) Expression of CUL3 of breast cancer patients correlates with poor overall survival. Scale bars: 50 μm. (E) Immunohistochemical analyses of 158 specimens from breast cancer patients using anti-BECN1 and anti-CUL3 antibodies were performed. Representative images of IHC staining of tumors form two human breast cancer patients are presented. (G) Correlation study of BECN1 and CUL3 expression in the breast cancer consisting of 158 samples. (H,I,J) The tumorigenicity model of nude mice was constructed with the indicated cells, and then the presence or absence of a visible or palpable tumor was evaluated and tumor growth was monitored every 3 d (H). After the tumor volume exceeded 800 mm3, the mice were sacrificed, and the tumors were excised to determine the weight of them (I). The expression of BECN1 or CUL3 in the MDA-MB-231 cells subcutaneously inoculated into nude mice was detected by western blot analyses (J)