Figures & data
Figure 1. The autophagy-lysosomal pathway is inhibited during glial overgrowth induced by expression of Pi3K92E and ΔhEGFR. (A) Larval brain cells were separated by FACS. In controls, glial cells (GFP+) represent 10% of the total brain population, while, in gliomas, glial cells are up to 70%. Accordingly, glia overgrowth involves a strong reduction of neurons (GFP−) which are heavily decreased compared to control brains. Data represent the mean ± S.D. and P‐values are determined by Kruskal Wallis test with Dunn’s Multiple Comparison. (B and C) mRNA expression of repo (glia) and elav (neurons). repo levels are strongly increased in gliomas compared to controls. Conversely, elav levels are heavily suppressed in gliomas samples. RpL32 is used as a housekeeping control. Data represent the mean ± S.D. and P‐values are determined by Mann-Whitney test. (D) Western blot showing repo and elav protein levels. repo levels confirm a strong expansion of glial tissue in gliomas, while elav protein levels are strongly decreased in tumor brains. βtub is used as a loading control. (E) Single medial confocal sections of third instar larval brains. High magnification insets are shown as merge and separate channels. Glial cell membranes (marked with anti-GFP), ubiquitin (marked by anti-ubiquitin FK2), ref(2)P are pseudo-colored as indicated. Notice the increased signal of both markers in gliomas compared to controls (quantified in Ei). Data represent the mean ± S.D. and P‐values are determined by t-test. Ubiquitin mostly colocalizes with ref(2)P. (F) Western blot showing expression of the autophagy markers ref(2)P and Atg8a I–II. In gliomas, ref(2)P protein levels are increased compared to controls, albeit Atg8a levels are only slightly changed. βtub is used as a loading control. (G) mRNA levels showing expression of autophagy genes. ref(2)P mRNA expression in glioma samples is strongly upregulated, while mRNA level of Atg1, Atg7 and Atg8a are comparable to controls. Data are expressed as fold increase relative to control brains (L2FvC). Data represent the mean ± S.D. and P‐values are determined by Mann-Whitney test. (H) ref(2)P expression levels in GFP+ and GFP− brains cells separated by FACS. ref(2)P levels are increased in GFP+ cells that belong to tumor tissue, but not in GFP− neural cells. Normalization on GFP+ cells of control brains. RpL32 is used as housekeeping. Data represent the mean ± S.D. and P‐values are determined by one-way ANOVA, Kruskal Wallis test with Dunn’s Multiple Comparison. (I and J) Single medial confocal sections of third instar larval brains reared under fed and starved conditions. Glial cell membranes are marked by GFP, Atg8a is detected by mCherry (mCherry::Atg8a). Note the strong increase of mCherry::Atg8a signal upon starvation in controls but not in gliomas. In contrast, upon starvation of gliomas ref(2)P is strongly accumulated (quantified in Ii and Ji). Data represent the mean ± S.D. and P‐values are determined by Mann-Whitney test
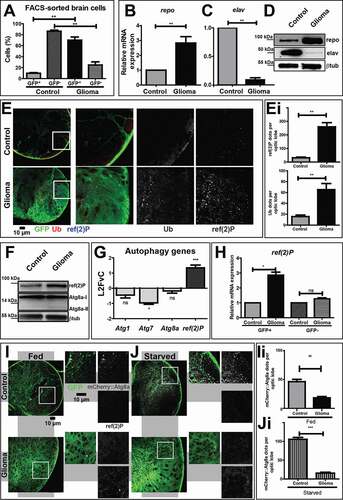
Figure 2. Autophagy in NS and characterization of the lysosomal compartment during gliomagenesis. (A) Representative EM images of NS treated with vehicle (Ctrl) and BafA1. ATP6V1G1High and ATP6V1G1Low NS show different accumulation of autophagic organelles (arrowheads) upon treatment. (Ai) Quantification of autophagic structures confirms that BafA1 causes accumulation of aberrant organelles only in ATP6V1G1Low NS. Data represent the mean ± S.D. and P‐value is obtained by one-way ANOVA, Kruskal Wallis test with Dunn’s Multiple Comparison. (B) qPCR analysis of the indicated V-ATPase subunits and of repo in fly glioma cells relative to control. mRNA expression levels confirm the upregulation of the V-ATPase subunits in fly gliomas. Data are expressed as L2FCvC. Bars, mean ± S.D. and P‐values are determined by two-way ANOVA with Bonferroni correction. (C) Western blot showing expression of YFP::Lamp1 (top) and Mitf (bottom). In gliomas, levels of both proteins are increased compared to controls. βtub is used as a loading control. (D) Single medial confocal sections of third instar larval brains. Nuclei were stained with DAPI, glial cell membranes with anti-GFP. Mitf is heavily accumulated in glioma compared to control optic lobes (quantified in Di). Data represent the mean ± S.D. and P‐values are determined by Mann-Whitney test. Mitf accumulation can be better appreciated in higher magnifications of insets. Notice that in gliomas, Mitf is almost exclusively in the cytoplasm, not in nuclei (insets). (E) Single medial confocal section of whole CNS of third instar larvae. Dorsal view, anterior up. Larval brains carrying gliomas in which Mitf has been downregulated show similar growth to gliomas(Quantified in Ei). Mean ± SEM and P‐values are determined by one-way ANOVA, Kruskal Wallis test with Dunn’s Multiple Comparison
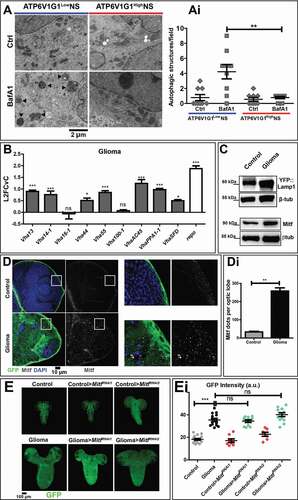
Figure 3. Downregulation of V-ATPase subunits restores normal growth and autophagy in cells subjected to gliomagenesis. (A) Single medial confocal sections of a whole CNS from third instar larvae. Dorsal view, anterior up. The excess growth of the glia, observed in gliomas, is reduced to control levels by the indicated depletions (quantified in Ai). Mean ± S.D. are shown, and P‐values are determined by one-way ANOVA, Kruskal Wallis test with Dunn’s Multiple Comparison. Example of pupae of the indicated genotypes is shown to the right of the CNS images (quantification below each panel shows the number of pupae reaching metamorphosis over the total). (B) ref(2)P mRNA levels by qPCR. Data represent the mean ± S.D. of n ≥ 3 independent experiments and P‐values are obtained by Kruskal Wallis test with Dunn’s Multiple Comparison. (C) Single medial confocal sections of third instar larval CNSs immunostained as indicated. The increased ubiquitin (Ub) and ref(2)P signal observed in gliomas, is absent in gliomas>VhaPPA1-1RNAi. See also insets on the right of each panel. (Quantification in Ci). Mean ± S.D are shown, P‐values are determined by one-way ANOVA, Kruskal Wallis test with Dunn’s Multiple Comparison. (D and E) Western blot showing levels of ref(2)P (D) or Mitf (E) in the indicated conditions. βtub (D) or Actin (E) are used as a loading control
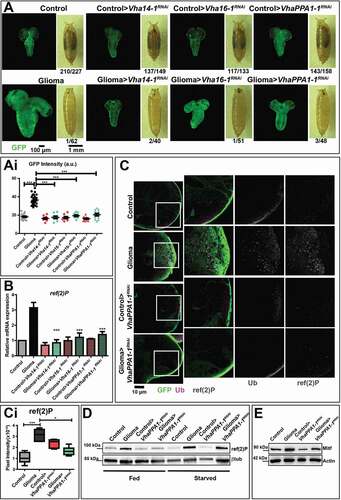
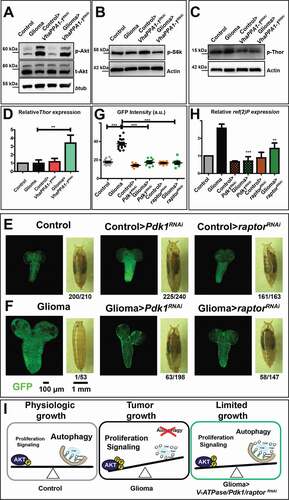
Figure 4. Effects on Akt signaling and gliomagenesis upon downregulation of VhaPPA1-1, Pdk1 or raptor. (A) Western blot showing Akt and phosphorylated Akt (p-Akt) levels. The increased p-Akt levels observed in gliomas are decreased upon VhaPPA1-1 downregulation. Total Akt (t-Akt) and βtub levels are used as loading control. (B and C) Western blot showing phosphorylated S6k (p-S6k; B) or phosphorylated Thor (p-Thor; C) levels. p-S6k or p-Thor levels in gliomas are decreased upon VhaPPA1-1 downregulation. Actin levels are used as loading control. (D) Thor mRNA levels by qPCR are upregulated in gliomas>VhaPPA1-1RNAi. Expression levels are relative to control brains. Data represent the mean ± S.D. and P‐value was obtained by one-way analysis of variance, Bonferroni’s Multiple Comparison Test. (E and F) Single medial confocal sections of a whole CNS from third instar larvae. Dorsal view, anterior up. The excess growth of the glia, observed in gliomas, is reduced to control levels by the indicated depletions (quantified in G). Mean ± S.D. and P‐values are determined by one-way ANOVA, Kruskal Wallis test with Dunn’s Multiple Comparison. Example of pupae of the indicated genotypes is shown to the right of the CNS images (quantification below each panel shows the number of pupae reaching metamorphosis over the total). (H) ref(2)P mRNA levels by qPCR. Data represent the mean ± S.D. and P‐values are obtained by one-way ANOVA, Kruskal Wallis test with Dunn’s Multiple Comparison. (I) A model for V-ATPase function in Drosophila larval gliomas. The physiologic balance between anabolic and catabolic processes governing normal cell growth (Physiologic growth) is heavily compromised in gliomas. Indeed, in tumor brains, growth is enhanced while catabolism is impaired (Tumor growth). Downregulation of VhaPPA1-1, Pdk1 or raptor restore the equilibrium controlling nutrient metabolism, ultimately derepressing autophagy and decreasing tumor growth (Limited growth)